UPDATE on new LADSPA ACDf plugin and version 2 of ACD:
LADSPA:
I have one more round of testing to do with the ACDf version 2 plugin. This has mostly been an effort to change the calculation method. I also renumbered some of the 2nd order filter types in a more logical fashion. This might be released on my web site (see link below) as early as this week.
Active Crossover Designer version 2:
To go along with the ACDf update, I have made some renovations of ACD, the measurement-based loudspeaker crossover design tools that I created. These were originally designed for IIR filters on the miniDSP, resulting in ACD version 1. Then I released a separate LADSPA version, ACD-L, with some new capabilities like multi-axis modeling but didn't update ACDv1. I'm now re-integrating the miniDSP functionality with the enhanced features found in the LADSPA version in the unified version, ACD2. I have re-defined how the shelving filters are calculated so that they are directly transferable to the miniDSP without having to resort to "advanced biquad" programming. The filter responses are identical whether implemented in LADPSA (software DSP) or using miniDSP hardware. This should make it possible to implement a crossover on either platform from a design created using the ACD2 tools and obtain the same response with either implementation.
To date I have made good progress on ACD2. The first pass of coding and testing the filters into the tools is completed. I will do some extensive testing before releasing the new version. In the near future I plan to use ACD2 to work up a loudspeaker crossover design or two, which I will post to my web site as a design example. I also need to work on the manual. I did not create an updated manual for ACD-L, so I will have to work from the older ACD version 1 manual. This will take longer to finish simple because of the volume of material.
Thanks for all the work! Very promising indeed... Down a ways from the Nyqvist frequency, will there be advantages in terms of efficiency or precision compared to the currently available filter set?
The changes have all been in how the transfer functions are calculated. This only happens once when the plugin is invoked. The subroutine that is used to process the audio stream hasn't been altered, although I might look into that in the near future if I have some time to do some profiling. IMHO any speedup would be very modest at best so its not a priority for me.
A few filters may improve in their accuracy, even far below the Nyquist frequency. For instance the pathological example earlier in this thread. For the most part the filter responses will be exactly the same, especially for the basic first and second order high- and low-pass filters.
Hi,
To learn a bit more, what is frequency pre-warping? (or where could I learn a bit more about that?
Best regards,
JMF
I can only give you references to info in English.
You could start here:
https://en.wikipedia.org/wiki/Bilinear_transform#Frequency_warping
Also a good read:
http://www.ece.uvic.ca/~andreas/ISCASTutorial/Part 3-IIR Filters-Bilinear Transformation Method.pdf
See especially starting on slide 11.
Google searches will return many other possibilities.
I've made some progress on the ACD tools spreadsheets. Actually I think I have completely finished the update to the new LADSPA + miniDSP version! What's next? Well...
When I released ACD-L I had intended to also release a multi-axis extension. I developed 99% of it and then got sidetracked or ran into a snag... it's been too long to remember exactly what. But it's still sitting there, and the supporting multi-axis spreadsheets are ready as well. So I might as well put it out there in some form or another and stop procrastinating.
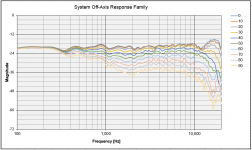
The multi-axis extension allows you to model the loudspeaker response on multiple axes and plot the curves as a line plot or a rectagular or polar heatmap (sometimes called a sonogram). These are just different ways to view the data, each with their own pros and cons. But if you are designing a loudspeaker and crossover to sound good you need to know both the on- and off-axis responses and how these change as you use different filters and EQ in the crossover. This makes all of that possible. It's pretty cool actually!
When I released ACD-L I had intended to also release a multi-axis extension. I developed 99% of it and then got sidetracked or ran into a snag... it's been too long to remember exactly what. But it's still sitting there, and the supporting multi-axis spreadsheets are ready as well. So I might as well put it out there in some form or another and stop procrastinating.
The multi-axis extension allows you to model the loudspeaker response on multiple axes and plot the curves as a line plot or a rectagular or polar heatmap (sometimes called a sonogram). These are just different ways to view the data, each with their own pros and cons. But if you are designing a loudspeaker and crossover to sound good you need to know both the on- and off-axis responses and how these change as you use different filters and EQ in the crossover. This makes all of that possible. It's pretty cool actually!
I finally remembered where I got bogged down with the multi-axis plotting extension: calculating the loudspeaker Directivity versus frequency, and DI. Luckily I recalled seeing a nice paper by Joe Tylka about how to calculate the directivity from measurements made along arcs around the loudspeaker. You can read it here:
https://www.princeton.edu/3D3A/Publications/Tylka_3D3A_DICalculation.pdf
I need to figure out how to allow the user to select which calculation will be performed, and how to notate the position in spherical coordinates on which each measurements was taken. Then it is just "plug and chug" as we used to call it. The one major limitation is that the angular increment for all angles must be the same. This can add up to a LOT of measurements unless the data is regressed in some way a la Geddes. But I am not up to that in a spreadsheet...
Also, because the multi-axis tool uses does more sophisticated things, most of the stuff requires Excel VBA. I'm frankly considering abandoning Open/Libre Office Calc support for this version. I can probably update the older version with a simplified tool set (e.g. on-axis modeling only) for Calc and that will satisfy 99% of the Calc users...
I definitely plan on using multi-axis modeling and plotting with my next OB speaker build, so I really should get this out the door!
I can only give you references to info in English.
You could start here:
https://en.wikipedia.org/wiki/Bilinear_transform#Frequency_warping
Also a good read:
http://www.ece.uvic.ca/~andreas/ISCASTutorial/Part 3-IIR Filters-Bilinear Transformation Method.pdf
See especially starting on slide 11.
Google searches will return many other possibilities.
Thank you Charlie. I add that to my "to read pile". And thank you a lot for all your tools !
Best regards,
JMF
Nice! Thanks for working on updating it. Let me know if you need help user testing it.
One feature request is to output the whole ecasound command in addition to the filter text string. In other words, the user also inputs all the parameters such as number of drivers, buffer, alsa Dac reference, sox, etc. The output is the complete ecasound command ready to be copied and pasted.
BTW, I read somewhere a while ago that excel can control terminal inputs to Linux and raspian via VBA. Using VBA could allow using real time parameter changes to the filter via ecasound's interactive mode. Not sure it will work and perhaps over kill...
On a slightly different topic, something really helpful for testing different settings and filters would be something that allow ABX comparisons. If interested, R Taylor posted some code on his blog but I don't have the skills to implement it with ecasound
Charlie,
It sounds like you've been extremely industrious! I have a question based on ignorance.")
Background: My midranges have whizzer cones that make dispersion very nice but they have a drawback. Some content played loudly, like operatic voices, 'break them up' and spoil the overall presentation. I can control that fairly well with two moderately sharp EQ attenuations. But at moderate volume the system + room doesn't need this preventive 'correction'.
So what would be ideal for this kind of problem (and some kinds of room issues) is an EQ that is sensitive to the 'quantity' of the known exciting frequency. It would only kick-in as needed above a threshold. Is there a way to combine filters to achieve that effect? ...or a way to code together a combined EQ+threshold function? ...or a way to make an EQ remove only a certain percentage of a signal rather than a fixed number of dB? ...would something like that be an interesting tool for the ACD toolbox?
Cheers!
F.
It sounds like you've been extremely industrious! I have a question based on ignorance.
Background: My midranges have whizzer cones that make dispersion very nice but they have a drawback. Some content played loudly, like operatic voices, 'break them up' and spoil the overall presentation. I can control that fairly well with two moderately sharp EQ attenuations. But at moderate volume the system + room doesn't need this preventive 'correction'.
So what would be ideal for this kind of problem (and some kinds of room issues) is an EQ that is sensitive to the 'quantity' of the known exciting frequency. It would only kick-in as needed above a threshold. Is there a way to combine filters to achieve that effect? ...or a way to code together a combined EQ+threshold function? ...or a way to make an EQ remove only a certain percentage of a signal rather than a fixed number of dB? ...would something like that be an interesting tool for the ACD toolbox?
Cheers!
F.
Here's the link to the ABX script: An R Script for ABX Testing | Richard's Stuff
Funny you mention this. I was just tinkering around with exactly that yesterday. The problem is that the array of inputs, outputs, and other options (e.g. piping to Sox, buffering, sample rate, etc.) starts to introduce quite a few extra variables into the mix and it gets messy with all the options. I can not know how the user will want to refer to their input device (e.g. ALSA) or perhaps a file (*.wav) or whatever. Does the user want to use the ecp file approach (a la Richard Taylor) or just call the filters directly using -el: under ecasound. Maybe the user doesn't even want to use ecasound! At some point I need to rely on the user educating themself on how to properly select these options and implement the filters within the Linux audio tools of their choice. To provide some smidgen of guidance, I could provide an ecasound example in the manual as part of an example crossover system. An example would be especially helpful if my mTAP LADSPA plugin is used to implement the digital delay - even I have to refresh my memory on how this is done properly!Nice! Thanks for working on updating it. Let me know if you need help user testing it.
One feature request is to output the whole ecasound command in addition to the filter text string. In other words, the user also inputs all the parameters such as number of drivers, buffer, alsa Dac reference, sox, etc. The output is the complete ecasound command ready to be copied and pasted.
Yes, using VBA you can call the OS and run commands. It's not possible to run Excel with VBA on a Linux system because even if you have Excel running under Wine or whatever, VBA doesn't function (I tried it!). One approach would be to call a Windows command line SSH program that would communicate over your LAN to the Linux computer and control ecasound there. Maybe that could be a future extension... but it's not at the top of my to-do list. You can just manually open an SSH program with a GUI and paste in the filter text strings using that interface. Again, it's a matter of how complicated this kind of thing would get, and in this case trying to automate something that can easily be done manually just doesn't have a great payoff IMHO.BTW, I read somewhere a while ago that excel can control terminal inputs to Linux and raspian via VBA. Using VBA could allow using real time parameter changes to the filter via ecasound's interactive mode. Not sure it will work and perhaps over kill...
I would recommend doing the following:On a slightly different topic, something really helpful for testing different settings and filters would be something that allow ABX comparisons. If interested, R Taylor posted some code on his blog but I don't have the skills to implement it with ecasound
1. create loudspeaker crossover A
2. create loudspeaker crossover B
3. create separate ecasound command strings for A and B as script files
4. when you want to change A to B, kill one and launch the other.
You could put (4) into a script in a loop that waits for user input. When the user types either "a" or "b" the script automatically does (4). There will be only a very slight pause.
There is really only so much functionality that I feel is worth building into an Excel application. This is DIY, so the rest is up to your imagination. If you get stuck or don't know how to write a bash shell script, start a new thread asking for help on that topic (try Google first). In that way everyone can learn from the trail of info that is left behind.
Here's the link to the ABX script: An R Script for ABX Testing | Richard's Stuff
This is a pretty nice little R ABX tool. To make it work (I think) Richard calls ecasound from "within" MPD. You would do this by setting up the ecasound command string in each output (he refers to them as "A" and "B"). There are examples on the web showing how to do this (perhaps on Richard's web site).
It doesn't need to cover every single option available but perhaps just a few commonly used one as a starting point. But it works fine as is as well.The problem is that the array of inputs, outputs, and other options (e.g. piping to Sox, buffering, sample rate, etc.) starts to introduce quite a few extra variables into the mix and it gets messy with all the options.
I need to find some time to play around with the abx script and if so I'll start a new thread (probably won't happen in the near future). I want to use it not only for testing ladspa filters but also if my equipment and ears can tell a difference of sample rates. I'm also thinking it could be used to try out different DACs and other equipment too...?
I finally remembered where I got bogged down with the multi-axis plotting extension: calculating the loudspeaker Directivity versus frequency, and DI. Luckily I recalled seeing a nice paper by Joe Tylka about how to calculate the directivity from measurements made along arcs around the loudspeaker. You can read it here:
https://www.princeton.edu/3D3A/Publications/Tylka_3D3A_DICalculation.pdf
I need to figure out how to allow the user to select which calculation will be performed, and how to notate the position in spherical coordinates on which each measurements was taken. Then it is just "plug and chug" as we used to call it. The one major limitation is that the angular increment for all angles must be the same. This can add up to a LOT of measurements unless the data is regressed in some way a la Geddes. But I am not up to that in a spreadsheet...
Also, because the multi-axis tool uses does more sophisticated things, most of the stuff requires Excel VBA. I'm frankly considering abandoning Open/Libre Office Calc support for this version. I can probably update the older version with a simplified tool set (e.g. on-axis modeling only) for Calc and that will satisfy 99% of the Calc users...
I definitely plan on using multi-axis modeling and plotting with my next OB speaker build, so I really should get this out the door!
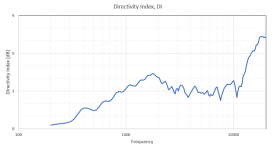
Well after a lot of hard work and re-work and head scratching I have gotten the Directivity calculations up and running. In the end I didn't use the method from the paper linked to above - it doesn't seem right to me based on the definition of the directivity index. So I went back to Beranek and implemented it based on formula 4.22, which seemed to make total sense to me from what I know about integrating a quantity over the surface of a sphere. The results are plotted both in terms of the directivity factor (Q, dimensionless) and the directivity index (the more commonly seen dB scale).
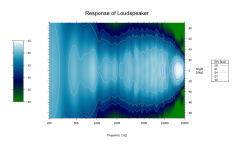
So, things are coming together nicely with this project. I need to review the heatmap plotting - I will be offering this in rectangular coordinates as well as in polar coordinates, which is a really cool way to view the data because it's actually representing physical space directly instead of stretching it as the rectangular version does.
One nice feature of my setup is that you can go back and gather more data and put it into the data entry sheet at the "end" (in the first non-filled column past all the existing data to the right). For example if you took data every 20 degrees and then realized that you need to increase the point density near 45 degrees to better resolve a feature in that area you can simply add in a couple more measurements as needed. It doesn't matter whether the resulting new set of data is evenly spaced or not (the angle between measurements can vary). After importing the new data, the user clicks a button and the data is re-ordered as needed and the directivity calculation is adjusted to account for the uneven spacing.
This extension can be used with the ACD tools to model multi-axis responses, or can be supplied with measured frequency responses taken in a measurements package. This makes it useful for a variety of loudspeaker related plotting needs.
Attached are a couple of plots from the multi-axis plotting tool. The first is your usual line plot, showing responses from one-half of the forward horizontal plane. The second is the directivity index for that same data. The speaker is a 2-way with an 8-inch woofer and horn loaded tweeter. Can you see the signature of the drivers and crossover in both plots?
Attachments
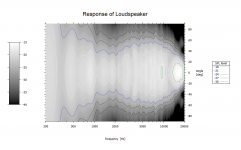
I spent the day working on a "heatmap" plot - a rectangular plot of the loudspeaker's response on multiple axes with SPL level shown using color(s). There is a thread I started back when I was getting into this stuff in the Software forum, but I thought I would post it here now that it is tied into the LADSPA stuff and somewhat PC/computer related.
I used the data shown in the line plot in the previous post and put it into the rectangular heatmap format using a GNUplot script that I had previously gotten working (see attached plots). Today I was working on how to position the color legend and the SPL levels legend, and how to control the colors of the SPL levels. GNUplot can sometimes be a bit of a PITA, but once you figure it out there you go. The user can now control these at will.
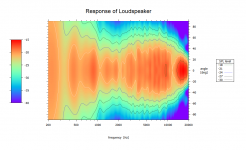
I am also able to allow the user to choose from a variety of color schemes for the plot. In fact they can read up on GNUplot pm3d color maps (there is a web page of examples for this) and come up with their own color scheme if one of these is not what they desire. I have given a couple of examples below from the wide array of possibilities.
Hope that this sparks some interest.
I used the data shown in the line plot in the previous post and put it into the rectangular heatmap format using a GNUplot script that I had previously gotten working (see attached plots). Today I was working on how to position the color legend and the SPL levels legend, and how to control the colors of the SPL levels. GNUplot can sometimes be a bit of a PITA, but once you figure it out there you go. The user can now control these at will.
I am also able to allow the user to choose from a variety of color schemes for the plot. In fact they can read up on GNUplot pm3d color maps (there is a web page of examples for this) and come up with their own color scheme if one of these is not what they desire. I have given a couple of examples below from the wide array of possibilities.
Hope that this sparks some interest.
Attachments
Hi, Charlie,
I'm a bit slow at the moment, as I received at the same time a lot of missing parts for my project. They allow me to finalize my speakers, that I will try using your current version of the ACD tools and the Alsa Virtual multi channel device build from my two USB full digital amps.
When all this sorted out, I will be happy to experience your new version of the tools ;-)
I wanted also to compare the behavior of the miniDSP and RT plugings near the nyquist frequency.
Best regards,
JMF
Dear Charlie,
I would appreciate a small confirmation about the usage of the mTAP function with ecasound in my specific case where I output the L and R channels to different devices and amps. Should it look as something below?
Is there a way to address both channels with one mTAP ? Could the mTAP be at the beginning of the chain before the spliting to the 2 devices, instead of at the end before the output (I don't know about the transitivity rules about all those operations)?
Best regards,
JMF
I would appreciate a small confirmation about the usage of the mTAP function with ecasound in my specific case where I output the L and R channels to different devices and amps. Should it look as something below?
Code:
ecasound -i chan_labels_4.wav -o:loop,1 \ -a:device1,device2 -i:loop,1 \ -a:device1 -chorder:1,2 -el:mTAP,0,0.006 -o:alsahw,1,0 \ -a:device2 -chorder:3,4 -el:mTAP,0,0.006 -o:alsahw,2,0Is there a way to address both channels with one mTAP ? Could the mTAP be at the beginning of the chain before the spliting to the 2 devices, instead of at the end before the output (I don't know about the transitivity rules about all those operations)?
Best regards,
JMF
- Status
- This old topic is closed. If you want to reopen this topic, contact a moderator using the "Report Post" button.
- Home
- Source & Line
- PC Based
- LADSPA plugin programming for Linux audio crossovers