Other thing is to make sure you use an appropriate apodization- otherwise, the discontinuities at the beginning and end of the sample period will make things look awfully funny.
This I made sure of.
That’s why the “No Window Function” FFTs look clean.
Funny though that windowed FFTs of the same properly apodized files don’t look clean. Why?
In the first part of the file, what is the magnitude and phase spectrum? Same question for the second half. You don't want to look at the portion around the discontinuity- that will give you nonsense data.
SY,I guess you are referring to an FFT amplitude and FFT Phase.
What I have for FFT analysis is only the program RMAA 5.5
To the best of my knowledge, it doesn’t provide such an analysis option.
It's certainly easier to look at the original waveform, but you can always do an inverse FFT to recover that if all you have is the transformed spectrum.
Indeed I worked from the original waveform. Besides I don’t have an Inverse FFT program .
I know that I am a cruel mere user of an FFT program. That’s why I ask if I have done it in the wrong way (I am still all ears).
")
Regards
George
I'd grab a section of the wav file, convert it to text, paste it into Excel, either pick an interval bounded by zero crossings or multiply the values by an apodization function, then transform. RMAA is not appropriate software- it's better for looking at transfer functions and can't do waveform analysis.
Going back the the pulse and impulse files of a few days ago. They made quite a splash. It was thought by some that perhaps using an impulse to test amps would reveal things that a swept sinewave or MLS noise signal would not. Matching impulses could match the sound of amps.
I thought that was interesting enough to look into and have been running pulses, sweeps and MLS to see if they differ.
As far as I can tell, they don't. Running a series of impulses click, click, click, a sweep - Oooooooweeep! , or MLS noise Ssssshhhhhhhh makes no difference in the resulting impulse. Maybe the sweep looks a tiny bit cleaner than the others, that's all. With a given DUT, all 3 approaches yielded the same results. And all 3 showed the differences between DUTs in the same way.
I will try to publish the results tomorrow, perhaps in a different thread.
Sorry Pano for interfering.
Thank you SY. I will see what I can do.
Ed, we agreed for ouzo. Didn’t we?
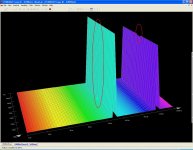
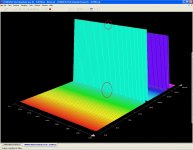
I know that it isn’t what you are asking for, but below is a 3D representation of the 3 files.
At.1&2 are original Ed’s file.
Att. 3&4 are Klaus brickwalled version.
Att.5&6 are gapless version.
Vertical axis is amplitude (linear)
Regards
George
I'd grab a section of the wav file, convert it to text, paste it into Excel, either pick an interval bounded by zero crossings or multiply the values by an apodization function, then transform. RMAA is not appropriate software- it's better for looking at transfer functions and can't do waveform analysis.
Thank you SY. I will see what I can do.
Just share the wine this time!
Ed, we agreed for ouzo. Didn’t we?
In the first part of the file, what is the magnitude and phase spectrum? Same question for the second half. You don't want to look at the portion around the discontinuity- that will give you nonsense data.
I know that it isn’t what you are asking for, but below is a 3D representation of the 3 files.
At.1&2 are original Ed’s file.
Att. 3&4 are Klaus brickwalled version.
Att.5&6 are gapless version.
Vertical axis is amplitude (linear)
Regards
George
Attachments


Last edited:
I thought that was interesting enough to look into and have been running pulses, sweeps and MLS to see if they differ.
As far as I can tell, they don't.
No surprise whatever. That's the whole point of those methods. MLS will give you the best measurement s/n for a given time because of throughput.
Speakers are a different issue- you can definitely see differences between the different excitation methods.
The click is gone, and my ears must be really shot if others hear a difference between the two halves. Because I don't.
vac
in gpapag's file tick is not completly gone. Not audible, but visible on spectogram or spectrum analyzer. There is still audible difference between first and second part of the file, which can be described as some added high freq pitch or kind of extra harmonic component added or more harshness, like Ed Simon described. But less and harder audible in Gpapag's file (without tick) and easier audible in Ed Simon's file (with tick).
There is another difference between files. In Gpapag's file (without tick) right in the middle of the file, there are some audible anomalies. For the fraction of the second, sound is "wawing". Kind of Doppler effect, hard to describe, like source is moving forward/backward, but only for the fraction of the second.
In Ed Simon's file (with tick) this "waving effect" is not audible. Masked by the tick?
Please listen to both files and tell me that my ears are playing games with me. I would be happy to hear this, since those differences are puzzling me.
Another thing:
my youngest child (boy, 12 yrs) hates music, especially he hates old rock music from 70' and 80' that I'm used to listen
Anyway, I asked him to listen to Ed's file (with tick). His face turned to grimace and after the tick he put fingers in the ears and start jelling at me to turn damn thing off. He dislikes whole file, but second part more than first part.gpapag, I had a forehead slap this morning while out poking around in the fossil beds. As long as you have Excel, you don't need Ed's file- you can generate the functions (and any related ones) by creating a column of time values, a column of Asin(w1t) + Bsin(w2t - phi), and a column of Asin(w1t) + Bsin(w2t + phi). You can make the relative amplitudes and phases anything you like. You can then Fourier transform the functions and plot out magnitude and phase. If eyeballing is difficult, subtract the two phase curves.
If anyone runs out of the room screaming from a 30 degree phase shift, the ABX function in foobar2000 may prove useful.
If anyone runs out of the room screaming from a 30 degree phase shift, the ABX function in foobar2000 may prove useful.
gpapag, I had a forehead slap this morning while out poking around in the fossil beds. As long as you have Excel, you don't need Ed's file- you can generate the functions (and any related ones) by creating a column of time values, a column of Asin(w1t) + Bsin(w2t - phi), and a column of Asin(w1t) + Bsin(w2t + phi). You can make the relative amplitudes and phases anything you like. You can then Fourier transform the functions and plot out magnitude and phase. If eyeballing is difficult, subtract the two phase curves.
If anyone runs out of the room screaming from a 30 degree phase shift, the ABX function in foobar2000 may prove useful.
There are a couple of free options (SoX?) that will make .wav's from Excel or any tab/comma delimited lists of numbers too.
to minimize learning effort if you already use (free) Ltspice it can read/write .wav files, the arbitrary sources can define very complex waveforms, modulation, switching using the "time" keyword and the functions, including the U() "step" that can "turn on/off" pieces of the waveform equation
the fundamental null asc linked in http://www.diyaudio.com/forums/software-tools/101810-spice-simulation-37.html#post1333137 shows how to do somewhat advanced processing math in Ltspice with arbs
http://www.diyaudio.com/forums/digi...g-cd-players-considered-bad-4.html#post754029 more exampel wave math
and you can analyze in the wavefrom viewer/fft windows
for more serious signal processing math there are free MatLab workalikes, Octave and SciLab (I use SciLab)
Last edited:
George, the wine was to calm the wife! Ouzo for me!
John, I thought it was in the ASSP Journal as a casual piece between 75 & 80, but it could have been spectrum.
Guys, I tried several different phase shift and frequency combo's. I though this one was low enough and shifted enough it was obvious. It was not meant as a test of listening ability! It was meant as a demonstration of the true bandwidth required for good audio reproduction!
So my OPINION is that everyone hears things a bit differently and what may be perfect for one may be inadequate for another!
gpapag, I had a forehead slap this morning while out poking around in the fossil beds. As long as you have Excel, you don't need Ed's file- you can generate the functions (and any related ones) by creating a column of time values, a column of Asin(w1t) + Bsin(w2t - phi), and a column of Asin(w1t) + Bsin(w2t + phi). You can make the relative amplitudes and phases anything you like. You can then Fourier transform the functions and plot out magnitude and phase. If eyeballing is difficult, subtract the two phase curves.
If anyone runs out of the room screaming from a 30 degree phase shift, the ABX function in foobar2000 may prove useful.
SY
Thank you for thinking of my case.
What you suggest is an arbitrary waveform generation. I’ll have that in mind for further use
Right now I am working on the outlines of your previous post http://www.diyaudio.com/forums/analog-line-level/146693-john-curls-blowtorch-preamplifier-part-ii-1519.html#post2679631
I found a free wav. to txt. Converter Download Watex 1.0 Free - Wave to txt-file converter - Softpedia
called “Watex_1. Very easy and handy program.
I imported the numerical data (real numbers with a value btn –1 and +1) which represents the amplitude of the wave file into a column of Excel.
I performed the Fourier function which produced another column with complex numbers of the form x+yi. And here I am stuck, because I can not produce the diagram that should look like a spectrum.
If you can provide any hint I would appreciate
Geez, many responds further down
Regards
George
Stormsonic.
I have some indications that there are some slight spectrum differences at the beginning and end (away from the middle) between my version and original Ed’s file.
Kind of weird, I am looking into this. If and when I have some data I’ll respond.
Scott and jcx thank you for the info.
Now, Ed
I’ve learned that it’s fatally wrong for a husband to calm his wife.
It’s like trying to calm your enemy. Both read it as a sign of weakness.
I am with a purple eye and a twisted arm, but as Cal Weldon wrote once: "Stick to your guns son" (or something like this). This week I’ll burn a bigger fish.

Here we go again!
Ed I have asked a straight question and there was no answer
http://www.diyaudio.com/forums/analog-line-level/146693-john-curls-blowtorch-preamplifier-part-ii-1516.html#post2678569
This is different (and I agree). Each one's aural perception and hearing (physical) capabilities.
Regards
George
I have some indications that there are some slight spectrum differences at the beginning and end (away from the middle) between my version and original Ed’s file.
Kind of weird, I am looking into this. If and when I have some data I’ll respond.
Scott and jcx thank you for the info.
Now, Ed
George, the wine was to calm the wife!
I’ve learned that it’s fatally wrong for a husband to calm his wife.
It’s like trying to calm your enemy. Both read it as a sign of weakness.
I am with a purple eye and a twisted arm, but as Cal Weldon wrote once: "Stick to your guns son" (or something like this). This week I’ll burn a bigger fish.
Ouzo for me!
Guys, I tried several different phase shift and frequency combo's. I though this one was low enough and shifted enough it was obvious. It was not meant as a test of listening ability! It was meant as a demonstration of the true bandwidth required for good audio reproduction!
Here we go again!
Ed I have asked a straight question and there was no answer
http://www.diyaudio.com/forums/analog-line-level/146693-john-curls-blowtorch-preamplifier-part-ii-1516.html#post2678569
"Have you heard it through a software without this bandwidth restriction? If yes, what’s the bandwidth and how it sounded (or it didn’t sounded at all?")?
So my OPINION is that everyone hears things a bit differently and what may be perfect for one may be inadequate for another!
This is different (and I agree). Each one's aural perception and hearing (physical) capabilities.
Regards
George
I imported the numerical data (real numbers with a value btn –1 and +1) which represents the amplitude of the wave file into a column of Excel.
I performed the Fourier function which produced another column with complex numbers of the form x+yi. And here I am stuck, because I can not produce the diagram that should look like a spectrum.
If you can provide any hint I would appreciate
OK, you need to convert those numbers into polar coordinates, i.e., magnitude and phase (magnitude = sqrt(x2 +y2), phase = arctan (y/x)). Then you can use the plotting functions of Excel to make spectral plots.
- Status
- Not open for further replies.
- Home
- Member Areas
- The Lounge
- John Curl's Blowtorch preamplifier part II