Got to agree with you here John (JN), its nice to have a break from the general noise we generate on this thread and learn more, in this case something that is relevant to myself.
This thread covers many interesting topics that help us all increase are understanding, intermixed with the usual grumpy old men bickering sessions, I love it.
This thread covers many interesting topics that help us all increase are understanding, intermixed with the usual grumpy old men bickering sessions, I love it.
Which is why I questioned you on that 725 hz and 1380 uSec thing.
I am confident the 1.5 is a result of training.
John
You shouldn't have.
I was kidding about 1.5 uSec, blind ping pong, fortunate mutations and training b.t.w. I hold it to be highly unlikely that auditory system can discriminate to that level even under those conditions.
https://mpora.com/longform/daniel-kish-blind-cycle-batman#1XMIbP00cT0Y7Mt7.97
amazing what you can train your brain to do.
amazing what you can train your brain to do.
WOW.
For another 'wow/out of body' experience, perhaps not quite to the same level, try running a few km along a beach on the smooth/hard/moist sand, with eyes shut alongside a trusted friend to guide/warn you.....you won't be the same afterwards.
Dan.
Be careful what you wish for. When I was in Portland, Gary Pimm and I spent a day in the lab measuring mains line noise and line filters. We did spectrum analysis from about 10Hz, to several MHz.I have explained elsewhere that I like to put mains filters in reverse (!) on equipment that generates a lot of mains junk like not-so-clean SMPSs.
We found that
- Line noise changes all the time, so it's hard to get a good A/B plot
- Some line filters are not very good (of course)
- A high impedance path for noise back INTO the mains isn't always a great idea.
OK that was part one of my dumb question .Parts two and three I am still mulling and thinking maybe Bruno was right with the kii3. I have read somewhere he uses current drive for the bass units which 'might' drop out from this line of thinking. But easy to fall into the rabbit hole of lower DF gives better bass response and miss the point.
What does "bass response" mean?
Frequency response?
Flatness?
Extension?
Or something else?
Best define more closely.
Richard,
I have explained elsewhere that I like to put mains filters in reverse (!) on equipment that generates a lot of mains junk like not-so-clean SMPSs.
Mains filters are asymmetrical normally and set up to block junk coming from the mains (or from other equipment, through the mains). But if you can block junk from going into the mains in the first place, your whole installation benefits.
Comments?
Jan
For a given "filter" what is different when looking at it from one side vs. the other? Does the filter "curve" change depending on which side is the load?
_-_-
Linear Integrated Systems just introduced its LSJ689, a dual, P-channel JFET which is the complement to its LSK489, a dual, N-channel JFET. This new, dual, P-channel JFET has an excellent noise voltage spec at 1.8 nV/√Hz at 1 kHz with low input capacitance (8 pF typical).
anTime for the great thaw to set in.
View attachment 565444
Blumlein showed that intensity panning, in this drawing full amplitude to speaker A and half amplitude to speaker B, will lead to the creation of a phantom image of which both amplitude and phase add up correctly at the ears of the listener. That is why imo he became known as the inventor of stereo; he was the first to prove this mathematically .
It is good to refresh your trig to calculate the phase shift at the listeners ears (if you are so inclined) for a single case. Blumlein wrote the derivation out and I remember having studied it when all such info came to us in paper form. Must be on the internet somewhere. Can´t find a link but would be thankful if someone would post one.
I ran the math years ago. For two speakers, there are 2 events which occur temporally.
1. When initial fronts hit the ears. Right to R, Left to L.
2 When initial fronts hit the opposing ears.
Given intensity only panning, at "1" there is no ITD to key direction but there is intensity difference. This does not occur naturally, is a forced condition we need to interpret.
At 2 (diffraction limited), the opposing ear hears the intensity difference, but now reversed. At this time, the brain has to distinguish the wrong intensity/direction cues, but they present an image symmetrically opposite the original. So, the brain does it's first come, first served thing.
What also needs to be considered it the way the intensity falls off with source. I've done the math for point sources (spherical propagation and 1/r squared falloff), line sources (cylindrical propagation and 1/r falloff), and planar source (no falloff near field.)
Additionally, I did the math to determine what differentials in intensity and timing would do to the positioning of an image in the soundstage. For example, how tight ITD had to be to maintain a positional accuracy of say a foot uncertainty when an image is 15 degrees to the side of center. I'll try to find some of the graphs, not sure which computer they are on.
edit: Needless to say, my math and understandings do not agree with Blumlein. There is no way to alter the actual ITD at the ears unless one is only considering sine excitation. I never consider sines in my analysis, as I rarely listen to them.
You shouldn't have.
I was kidding about 1.5 uSec, blind ping pong, fortunate mutations and training b.t.w. I hold it to be highly unlikely that auditory system can discriminate to that level even under those conditions.
I wasn't. I do not expect that level of discernment in the wild. It is only useful as a lower bound.
John
Last edited:
Would you please show how to use this result, to analyze a "filter" composed of three isolation transformers in series?For the device being powered, it seems that a having the mains as a low impedance sink meant much cleaner power at the DUT than putting in a mains filter. With the filter, the noise had nowhere to go, expect into the DUT. I'm sure this can be designed around, but it's something to take into consideration.
Mains --> Primary_T1
Secondary_T1 --> Primary_T2
Secondary_T2 --> Primary_T3
Secondary_T3 --> DUT
If it's not compounding the inconvenience, please note any difference in the analysis when (a) the safety earth is connected straight thru all three transformers; (b) the safety earths are floating, disconnected, not used, and not very safe?
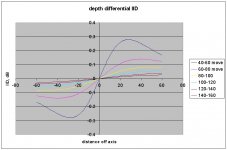
Ah, found a few. Did these back in 2005. These are for soundfield depth perception.
I think the depth differential IID plot uses a point source. ITD doesn't care.
These are the changes that occur when the source is moved by a distance from a specific distance. For example, a source 20 inches off axis 60 inches away will show a .1dB change if it is moved to 80 inches away.
For ITD, the difference will be 30 uSec for the same move.
John
Attachments

Last edited:
You shouldn't have.
I was kidding about 1.5 uSec, blind ping pong, fortunate mutations and training b.t.w. I hold it to be highly unlikely that auditory system can discriminate to that level even under those conditions.
FWIW, Bob Stuart of Meridian and MQA maintains it's 4usec.
I'm pretty sure it's optimistic as it is needed to justify MQA.
Jan
Be careful what you wish for. When I was in Portland, Gary Pimm and I spent a day in the lab measuring mains line noise and line filters. We did spectrum analysis from about 10Hz, to several MHz.
We found that
For the device being powered, it seems that a having the mains as a low impedance sink meant much cleaner power at the DUT than putting in a mains filter. With the filter, the noise had nowhere to go, expect into the DUT. I'm sure this can be designed around, but it's something to take into consideration.
- Line noise changes all the time, so it's hard to get a good A/B plot
- Some line filters are not very good (of course)
- A high impedance path for noise back INTO the mains isn't always a great idea.
Actually my secret recipe is two line filters back to back. But don't tell anybody!
Jan
FWIW, Bob Stuart of Meridian and MQA maintains it's 4usec.
I'm pretty sure it's optimistic as it is needed to justify MQA.
Jan
A very simple test that I used to do is: Take a piece of garden hose, 50-100cm, put both ends in your ears, then start tapping it. If you tap closer to the left early, you hear the sound coming from the left and visa versa. But there is a small section in the middle where you hear sound coming from the middle. Its a very small section of the tube. Simple arithmetic will get you the ITD for clicks. I don't know the exact number, but it's very short.
Redbook has a time resolution that is orders of magnitudes smaller than that number though.
That is interesting. Useful breakdown voltages are notable.Linear Integrated Systems just introduced its LSJ689, a dual, P-channel JFET which is the complement to its LSK489, a dual, N-channel JFET. This new, dual, P-channel JFET has an excellent noise voltage spec at 1.8 nV/√Hz at 1 kHz with low input capacitance (8 pF typical).
Is the Blumlein analysis just for a line in the plane of the speakers? Effectively assuming you cannot get 3 dimensions out of 2 speakers?
Blumlein showed that intensity panning over two loudspeakers produces a phantom image which is correct both in amplitude and phase in both ears of the listener, also at off-axis listening positions. There is no information about hight or depth coded as such. Good gain jockeys know how to create those dimensions by tricking the brain by introducing HRTF-like distortions.
I suspect his analysis only works for one frequency at a time, and steady state.Blumlein showed that intensity panning over two loudspeakers produces a phantom image which is correct both in amplitude and phase in both ears of the listener, also at off-axis listening positions. There is no information about hight or depth coded as such. Good gain jockeys know how to create those dimensions by tricking the brain by introducing HRTF-like distortions.
I will have to review his equations and assumptions to be sure.
John
Actually my secret recipe is two line filters back to back. But don't tell anybody!
Jan
Tell anyone what? We don't even know what you're using... asymmetrical and directional?
A bit odd.- Status
- Not open for further replies.
- Home
- Member Areas
- The Lounge
- John Curl's Blowtorch preamplifier part II