Hi George, It looks like you have been busy!! Once again nice dead bug work!
Hi Tony
How are you doing?
Still under moderator’s stress?
 I hope not.
Yes, I am busy with this. It seems that this thing can do the job. But I have to learn first how to test this “fit to job”.
I love dead bug construction. It takes time, stable fingers and good preplanning. Retrofitting is usually impossible.
I haven't looked at the slewing articles yet, but will have to do so.
What? And I was about to pass the exams questionnaire.
Read it, you’ll like it. The first part is the essential one.
The measurements showing the frequency response changes with gain are very telling! This is what you were telling me right back in the beginning when I was thinking of upping the gain on the LM324!!
Yes. Now you see what I was meaning.
Looks like your results pretty much match what the datasheet shows too!
They do. That’s encouraging.

Thanks for visiting.

The next one –two posts from me will have some interest on what you are after.

Regards
George
Slew Limiting
I was doing a manual frequency sweep on AD620 at quite less than half it’s max output swing, when I noticed that the output sine wave was turning into triangular wave while progressing at higher frequencies.
At the same time (I had the scope in “DC Coupling” mode) the whole wave was drifting up. This was dc offset at the output which was increasing with the increase of sinus to triangular wave transformation (read: distortion).
Aha I said, it seems that the distortion products (harmonics) of this transformation upset the dc conditions of the IC. Measuring this dc offset and correlating it once with the % distortion, may be a nice methodology to estimate the onset and amount of slewing for a circuit behaving this way.
After much testing and subsequent observation, I found out that this dc offset was not due to slewing itself, but due to turning of slewing into unsymmetrical slewing.
Therefore I abandoned this root, but I was left with the initial argent question of how to easily measure the effects of slewing in order to correlate [signal amplitude x frequency] with the [amount of slewing].
And there I was searching on the internet for ways to measure Slew distortion. Then it was that I found the three articles I have linked to already.
http://waltjung.org/PDFs/SID_TIM_1.pdf
http://waltjung.org/PDFs/SID_TIM_2.pdf
http://waltjung.org/PDFs/SID_TIM_3.pdf
Last edited:
I couldn’t expect for anything more as far as explanation and definitions (part I) and testing-measurements (part 2) were concerned.
But there is part 3 as well (analysis-calculation-prediction).
Going through this 3 parts-article several times, I was standing on my feet somehow better to do a few meaningful measurements.
First I had to choose a maximum output voltage for the AD620.
I intend to use it for feeding either the input of my oscilloscope (broadband measurements) or the input of my sound card (5Hz-20kHz measurements).
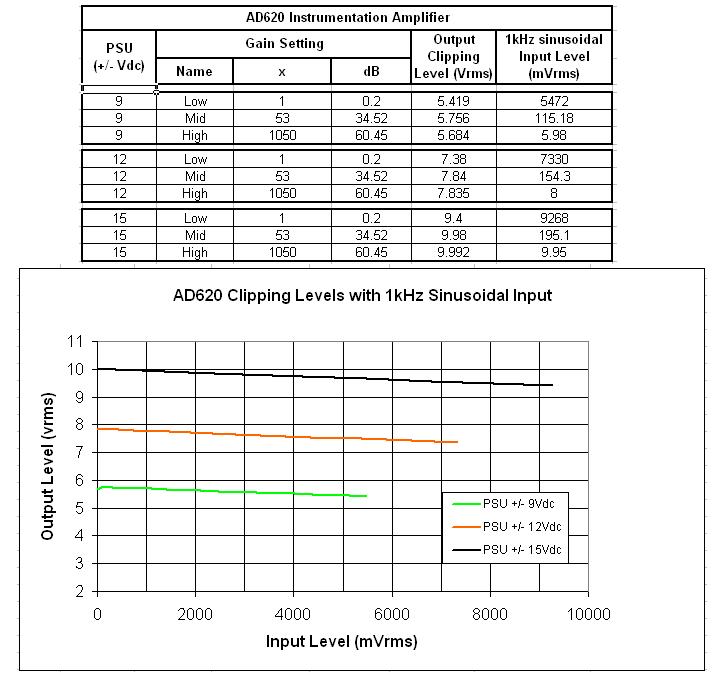
For the later (sound card), the max out from the AD620 needs to be the 0dB of the card’s input, thus 1.286Vrms (or 1.818Vp, or 3.637Vpp). This is almost 1/5th, 1/7th, and 1/9th of the max out with +/-9Vdc, +/-12Vdc and +/-15Vdc PSUs respectively. http://www.diyaudio.com/forums/attachments/equipment-tools/229262d1309365074-implementing-y-out-oscilloscope-manual-meas-clipping-level.jpg
Then I need to know the Slew Rate (SR) of the AD620.
The data sheet gives the SR minimum 0.75 V/us and the SR typical 1.2 V/us.
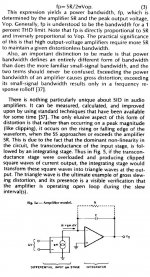
Part I, page 1, equation (3) provides the minimum frequency (fp) above which an Op. Amp with a typical architecture will start to Slew limit. (AD620 conforms to this typical architecture).
Plugging Vop=1.818Vp and SR=0.75 V/us into the eq. Fp=SR/2piVop per above, I get:
fp=67.5kHz.
Plugging Vop=1.818Vp and SR=1.2 V/us into the same equation, I get:
fp=105.1kHz.
Now I had to test these results in my “real world” case .
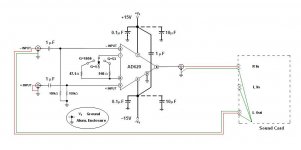
The test set-up:
[Sine wave Signal Generator] – [AD620 (+/-15Vdc PSU) in single-ended Input configuration loaded with 10kOhm dummy output load] – [Oscilloscope and RMS Voltmeter]
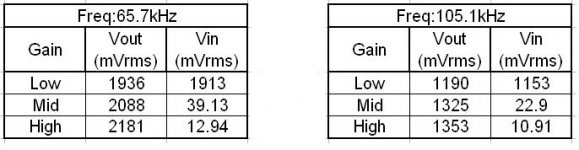
Results are tabulated on att.1
With signal of 65.7kHz the AD620 output is higher than 1286mVrms. This means that it’s fp is higher.
With signal of 105.1kHz the AD620 output is a bit lower than 1286mVrms. This means that it’s fp is a bit lower. (It is around 100kHz.)
But there is part 3 as well (analysis-calculation-prediction).
Going through this 3 parts-article several times, I was standing on my feet somehow better to do a few meaningful measurements.
First I had to choose a maximum output voltage for the AD620.
I intend to use it for feeding either the input of my oscilloscope (broadband measurements) or the input of my sound card (5Hz-20kHz measurements).
For the later (sound card), the max out from the AD620 needs to be the 0dB of the card’s input, thus 1.286Vrms (or 1.818Vp, or 3.637Vpp). This is almost 1/5th, 1/7th, and 1/9th of the max out with +/-9Vdc, +/-12Vdc and +/-15Vdc PSUs respectively. http://www.diyaudio.com/forums/attachments/equipment-tools/229262d1309365074-implementing-y-out-oscilloscope-manual-meas-clipping-level.jpg
Then I need to know the Slew Rate (SR) of the AD620.
The data sheet gives the SR minimum 0.75 V/us and the SR typical 1.2 V/us.
Part I, page 1, equation (3) provides the minimum frequency (fp) above which an Op. Amp with a typical architecture will start to Slew limit. (AD620 conforms to this typical architecture).
Plugging Vop=1.818Vp and SR=0.75 V/us into the eq. Fp=SR/2piVop per above, I get:
fp=67.5kHz.
Plugging Vop=1.818Vp and SR=1.2 V/us into the same equation, I get:
fp=105.1kHz.
Now I had to test these results in my “real world” case .
The test set-up:
[Sine wave Signal Generator] – [AD620 (+/-15Vdc PSU) in single-ended Input configuration loaded with 10kOhm dummy output load] – [Oscilloscope and RMS Voltmeter]
Results are tabulated on att.1
With signal of 65.7kHz the AD620 output is higher than 1286mVrms. This means that it’s fp is higher.
With signal of 105.1kHz the AD620 output is a bit lower than 1286mVrms. This means that it’s fp is a bit lower. (It is around 100kHz.)
Attachments
Last edited:
How did I actually test the onset of slew limiting?
By observing on the scope and comparing the output and input traces.
I don’t have a THD meter, so I had to find a way for to compare what I saw as onset of slewing with it’s THD equivalent.
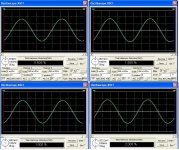
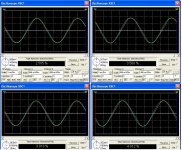
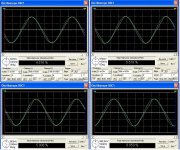
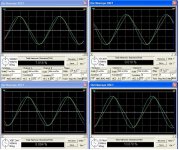
I simulated a simple inverting buffer IC for SID (Slew Induced Distortion) and did a series of virtual measurements.
Results on att. 1 to 4. Yellow sine is the output and cyan is the input.
The shape I was considering as the onset of Slew limiting while watching the real oscilloscope, was no better than the 2%THD and no worse than the 3% SID induced THD. Not very bad score.
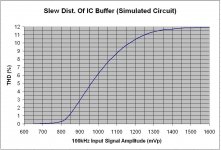
Using the simulation virtual measurements, I plotted a THD versus Signal amplitude curve for the case of x1 gain (att. 5).
You can see that it takes a very small increase of signal amplitude for the THD to increase quite a lot. In fact such small a signal increase, that it is very difficult to adjust it on an ordinary real signal generator.
Using this curve, one can also estimate a correction factor for adjusting the “observed” oscilloscope trace to a trace with a lower distortion figure.
E.g. a signal with an amplitude A producing a curve of 2% THD, has to be lowered by 5% for to produce a curve of 1% THD.
A signal with an amplitude B producing a curve of 5% THD, has to be lowered by 14 % for to produce a curve of 1% THD.
By observing on the scope and comparing the output and input traces.
I don’t have a THD meter, so I had to find a way for to compare what I saw as onset of slewing with it’s THD equivalent.
I simulated a simple inverting buffer IC for SID (Slew Induced Distortion) and did a series of virtual measurements.
Results on att. 1 to 4. Yellow sine is the output and cyan is the input.
The shape I was considering as the onset of Slew limiting while watching the real oscilloscope, was no better than the 2%THD and no worse than the 3% SID induced THD. Not very bad score.
Using the simulation virtual measurements, I plotted a THD versus Signal amplitude curve for the case of x1 gain (att. 5).
You can see that it takes a very small increase of signal amplitude for the THD to increase quite a lot. In fact such small a signal increase, that it is very difficult to adjust it on an ordinary real signal generator.
Using this curve, one can also estimate a correction factor for adjusting the “observed” oscilloscope trace to a trace with a lower distortion figure.
E.g. a signal with an amplitude A producing a curve of 2% THD, has to be lowered by 5% for to produce a curve of 1% THD.
A signal with an amplitude B producing a curve of 5% THD, has to be lowered by 14 % for to produce a curve of 1% THD.
Attachments
Last edited:
Hi George, you have been busy again! It is interesting to see the sine to triangle wave distortions. One thing I found when I was trying to use my pc soundcard as a scope was that I couldn't get clean sine waves above about 10Khz as they turned into triangle waves. Since getting a real scope I've found that the card generates very good sine waves all the way up to 90Khz, but it is the input that performs poorly.
I'm going to have to read the articles, the more I see the more I realize just how little I actually know and understand! You are way ahead of me on the voyage of electrical discovery
Tony.
I'm going to have to read the articles, the more I see the more I realize just how little I actually know and understand! You are way ahead of me on the voyage of electrical discovery
Tony.
It is interesting to see the sine to triangle wave distortions.
It was instructive for me. I hope it is useful for you too.
The simulation environment allow for noise free measurements, so that the important basic phenomena can be studied in isolation.
The simulation measuring tools provide diversity, flexibility and precision that I simply can never enjoy with real instruments in my amateurish lab.
But I always should have to do a sanity check on the results of these virtual measurements, provided the capabilities of my real instruments allow it .
Usually they don’t.
That’s why I have to look for trends (patterns and equations) and slopes with defined parameters, so I can interpolate with some confidence the data outside the limits of my real instruments with the data within these limits.
One thing I found when I was trying to use my pc soundcard as a scope was that I couldn't get clean sine waves above about 10Khz as they turned into triangle waves.
Most probably, the input signal you were feeding it with, had a product of [amplitude x frequency] that was causing the analogue input circuit to slew limit.
You have already got the picture. Next I will try to focus on the practical aspects and benefits (in terms of reduced SID) of the signal amplitude reasonable reduction within the AD620 and within the card itself.
I'm going to have to read the articles, the more I see the more I realize just how little I actually know and understand! You are way ahead of me on the voyage of electrical discovery
The article will clear the picture for you as it cleared it form me 10 days ago (that’s how “far way” I am ahead of you
). And then, new questions will come up and so it goes.Regards
George
Last edited:
I found out about the pristine qualities of simulation compared to real world in reverse The one area where the two have matched quite well was with my crossover modelling! But that was done using real world measurements so not the same as the difference between simulating entirely in spice and reality!
My biggest problem is that there are just too many things that interest me, and my somewhat obsessive nature means I spend a huge amount of time on one thing, so there is no way that I can dedicate enough time to all the things I would like to learn!
I just wish that I had more time (don't we all?) I've nearly finished the blueesr Hopefully will tonight
Tony.
The one area where the two have matched quite well was with my crossover modelling! But that was done using real world measurements so not the same as the difference between simulating entirely in spice and reality! My biggest problem is that there are just too many things that interest me, and my somewhat obsessive nature means I spend a huge amount of time on one thing, so there is no way that I can dedicate enough time to all the things I would like to learn!
I just wish that I had more time (don't we all?) I've nearly finished the blueesr Hopefully will tonight
Tony.
I thought to post some essential paragraphs from part I of the article. They are in att.1
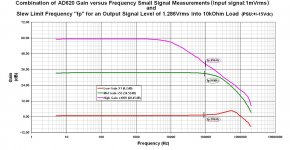
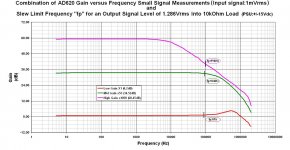
In att. 2 you see the small signal “Gain vs Frequency” of AD620 I posted earlier.
In this diagram I have marked the frequency “ fp” for the specific AD620 output of 1.286Vrms, which is the 0dB of my card’s input.
So now watching this diagram I can notice from which freq. and up the output signal will be slew limited, as well as what level of amplification will the output signal have at each frequency.
The “fp” noticed with careful real measurements using the oscilloscope, corresponds to a THD level of 2% to 3% (*PS)
So as per post #84, I generously (-10%) corrected each to an fp corresponding to a SID-induced THD of 1%. This corrected “fp” is the one marked on each curve in the diagram.
These “fp” are in good agreement with the theoretical (calculated) “fp” of post #83. It turns out that the Slew Rate of this AD620 is close to 1.07V/us
From the equation (3) (Fp=SR/2piVop) it follows that fp goes up as the output level goes down.
fp increases 10 times due to a 10 times reduction of Vop
fp increases 50 times due to a 50 times reduction of Vop and so forth.
I have verified this up to 2MHz, the freq. limit of my signal generator.
Regards
George
(*PS) Measured, uncorrected data:
Low gain: fp=90kHz
Mid gain: fp=104kHz
High gain: fp=110kHz
Attachments
Last edited:
Erratum (fp values)
Gentlemen (there are no ladies here, I am sure )
I just noticed the results of a new form of distortion acting on my brain. I call this HEID (Hot Environment Induced Distortion).
Distortion products are disorientation, dyslexia, luck of concentration, no interest for the other sex (but that’s irrelevant).
An example of the results of HEID can be seen on att.2 of the previous post.
The undistorted diagram is attached here, just for comparison.
My apologies
Gentlemen (there are no ladies here, I am sure )
I just noticed the results of a new form of distortion acting on my brain. I call this HEID (Hot Environment Induced Distortion).
Distortion products are disorientation, dyslexia, luck of concentration, no interest for the other sex (but that’s irrelevant
).An example of the results of HEID can be seen on att.2 of the previous post.
The undistorted diagram is attached here, just for comparison.
My apologies
Attachments
Here are your long missed auto measurements with varying signal level.
Att.1 is the measurement set-up. AD620 gain is set to “x1”
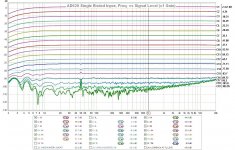
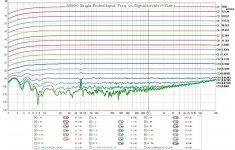
Att.2 are the curves with dB markings (on the right) relative to 0dB of the card. Reference frequency is 1kHz.
Att.3 are the same curves with corresponding signal amplitude in mVrms at the input of the card.
They are noiseless down to curve C14.
Compared to TL074 diagrams (post #64) where the last noiseless curve was C11 (-62.51dB), the AD620 goes lower by almost 16dB.
auto measurements with varying signal level.Att.1 is the measurement set-up. AD620 gain is set to “x1”
Att.2 are the curves with dB markings (on the right) relative to 0dB of the card. Reference frequency is 1kHz.
Att.3 are the same curves with corresponding signal amplitude in mVrms at the input of the card.
They are noiseless down to curve C14.
Compared to TL074 diagrams (post #64) where the last noiseless curve was C11 (-62.51dB), the AD620 goes lower by almost 16dB.
Attachments
Last edited:
Hi George, very nice result with the AD620! Very impressive that you can get measurements that clean down into the microvolt range!!
I'm a bit confused by the graphs in posts 88 and 89. The 60db gain seems to start rolling off at around 2Khz but you have the fp point at around 89Khz, Is this what the paragraphs are talking about with respect to the difference between power bandwidth and small signal bandwidth, ie you are basing on distortion (so power) rather than rolloff ie small signal? Not suffering from any HEID here at the moment. 14degC outside today
Tony.
Hi George, very nice result with the AD620! Very impressive that you can get measurements that clean down into the microvolt range!!
Yes Tony. They look pretty clean. Most or all of the LF noise at the very low signal levels is from the measurement set-up.
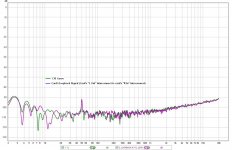
In att.1 I have placed C19, the lowest from the curves I posted above, together with the card's signal in loopback connection using the same interconnects used on the AD620. As you see, they are almost indistinguishable. This shows that the noise is not picked up by the AD620 circuit.
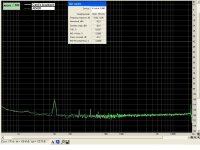
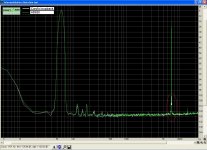
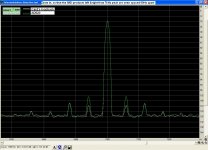
Some measurements from RMAA follow (att.2,3,4)
I'm a bit confused by the graphs in posts 88 and 89. The 60db gain seems to start rolling off at around 2Khz but you have the fp point at around 89Khz, Is this what the paragraphs are talking about with respect to the difference between power bandwidth and small signal bandwidth, ie you are basing on distortion (so power) rather than rolloff ie small signal?
The frequency roll-off (for each gain setting) occurs on any signal level.
In addition to this, you have to consider the fp point, which varies with the signal level.
High signal level = low fp (SID starts at lower frequencies, not good).
Low signal level = high fp(SID starts at higher frequencies, much better).
Attachments
Last edited:
Interesting that the IMD is only happening on the AD620 for one harmonic either side of the 7K signal, but the sound card clearly is contributing for four harmonics (assuming that is the right term to use). Looks like you have a similar level of 50Hz interference to what I have as well! my best results were around the -108db mark as well..
Tony.
Tony.
I count. Every some number of turns I draw a line on a paper. Then I add these lines….
I may upgrade to a higher technology though. Get myself an abacus.
Regards
George
Hi George,
Great transformer.
I found this on the ebay:
manual coil winding machine with mechanical counter, for a total of about € 60, from the seller 'toolsales'.
Not bad. & Saves you having to have a "lot of
afterwards" albert
Hi albert
This seems really good.
If I hadn't noticed the Chinese letters on it, I would be certain that it is a British gear from first "industrial revolution" times (I love equipment from that time period)
We all need an innocent excuse sometimes
Talking about excuses, you are the first one to post in this thread except Wintermute and me.
I’ll to that (although I just returned from a boozing session )

George
This seems really good.
If I hadn't noticed the Chinese letters on it, I would be certain that it is a British gear from first "industrial revolution" times (I love equipment from that time period)
Not bad. & Saves you having to have a "lot of
We all need an innocent excuse sometimes
Talking about excuses, you are the first one to post in this thread except Wintermute and me.
I’ll
to that (although I just returned from a boozing session )George
Last edited:
George,
I'm happy you don't say you can't buy it! (Joking: you might better buy it now with a hard currency.)
Well, I think you tackle some problems that many face who are for instance working on digital I/V stages, making differentials if I understand correctly what you have been doing.
Up till now developers in general glue a transformer against a couple of outputs like Jensen. And observe 'awe-inspiring' results or some other adjective.
That does deserve wider attention! I have a winding project laying in the drawer (the one where all the non-implemented ideas end up).
albert
ps you might look up what the concepts are behind some pre-amps of Mr. Nelson Pass, they make very good simple differential outputs without feedback.
Very off topic:
Well, honestly, I think, from a financial technologist point of view, the markets are wrong & the solution is quite different than all are saying.
Everyone is talking 'cut the budgets'.
Keynes was right: increase the budget & increase the tax rate across all sectors. It's that simple imho.
Looking at Greece & Italy with the 30-20 percent untaxed economy, the countries are intrinsic very prosperous.
That's my basic instinct.
albert
Albert, if I will advise you to count this “30%” of Greece to something around 45%, will I manage to boost your instict?
You are for Keynes you said?
You’re hired. Start early on tomorrow
Now, both of us are under the risk to be sin binned.
But Moderator, wait, there is a misunderstanding.
“Keynes” was a famous circuit designer and these “30-20 percent” refer to THD figures.
“Budget” is of course the project budget.
“the markets are wrong” is a reference to the market price of audio equipment not achieving Stereophile’s “A” rating.
Albert, if I will advise you to count this “30%” of Greece to something around 45%, will I manage to boost your instict?
You are for Keynes you said?
You’re hired. Start early on tomorrow
Now, both of us are under the risk to be sin binned.
But Moderator, wait, there is a misunderstanding.
“Keynes” was a famous circuit designer and these “30-20 percent” refer to THD figures.
“Budget” is of course the project budget.
“the markets are wrong” is a reference to the market price of audio equipment not achieving Stereophile’s “A” rating.
Sorry. Got carried away.
Quite correct. I'm trying to be polite. Add US with 10% unaccounted for dissipation in this lineup.
Keynes invented a positive feedback loop, with a delay line.
The trick was using a small trickle of bleeding current (B+) and recycle this into a multiplyer effect, probably co-inventing a white-cathode folloewr.
And yes the markets, that are the audio journalists that don't have a clue but I'm afraid that myself, hanging behind a scope sometimes for days, haven't got one either.
I need an economical forum like this
albert
- Status
- This old topic is closed. If you want to reopen this topic, contact a moderator using the "Report Post" button.
- Home
- Design & Build
- Equipment & Tools
- Implementing a “Y Out” on an Oscilloscope