...The signal drops quite orderly about 3 dB per octave from 4 kHz up. About the same response when connected to a DW transformer with no array connected...
This is very puzzling results. Are you saying the response for the DW and the Thordarson had this slope?
No simple arrangement of passive components results in a 3dB slope over several octaves...generally it is multiples of 6dB.
Did you happen to measure the voltage input to the primary to make sure it was flat?
I'll check on input and output voltages to ensure I'm not providing misinformation! A bit tricky using my computer and REW since the grounds on the transformer secondary may be a problem. Previously, I just connected a voltmeter to the secondary and did enough points to sense the curve, just like 50 yrs ago.
Ben
Last edited:
Here's data for ESL transformer fans, DW with flat input. Ratio is a hair under 1:100. Output measured at around 150 vac rms.
Flat from 10 Hz (no kidding) to around 5 kHz. About 5 dB eak around 12 kHz.
6k +1
8k +4
10k +5
12k +6
14k +3
16k -3
18k -1
20k -1
Measurements with my old Heath AC VTVM (about one meg ohm input resistance) and I tend to be cautious about measurements made with extreme devices, like the output of an ESL transformer.
Ben
Here's data for ESL transformer fans, DW with flat input. Ratio is a hair under 1:100. Output measured at around 150 vac rms. Flat from 10 Hz (no kidding) to around 5 kHz. About 5 dB eak around 12 kHz.
Now that looks more like a transformer should. Nicely done.

Did you get a chance to measure the Thordarson that drives the tweeter array? What did you do different this time from when you were measuring the 3db/oct slope in the response? Was the DW transformer driving the ESL at the time you made this latest measurement? If not, the 12kHz resonance peak and start of HF roll off will move down in frequency once the panels are connected. This resonance could be damped a bit with low value resistance in series with the primary. The one DW schematic I have seen shows a 2.7 ohm.
http://www.diyaudio.com/forums/planars-exotics/205136-ground-reference-esls-2.html#post2886152
For grins, I plotted your data in red on top of a recent measurement of my ESL transformer(step-up ratio = 1:140).
It is driving my segmented stator ESL and has a 2 ohm damping resistance in series with the primary.
Note that when transformers are driven by a low impedance source like ESL step-up transformers are, response will be flat to as low a frequency as the amplifier can provide the current required by the falling impedance of the transformer primary inductance. This is completely unlike transformer response in tube amps where they are driven by the fairly high source impedance of the tube. In that case you will see the LF response roll off once the transformer impedance becomes less than the source impedance. Even the Antek toriodal power transformers with their low primary inductance were flat to 10 Hz when driven directly by an amplifier as long as the voltage level was kept low enough to keep from saturating the cores. I posted a response for the Anteks driving a 1200pF ESL panel with 1 ohm in series with the primary. The addition of the 1 ohm resistance resulted in a response down just 1dB at 20Hz.
http://www.diyaudio.com/forums/planars-exotics/225959-toroids-esls-4.html#post3306102
But, we all know that core saturation limits their practical use to frequencies > 300Hz. In contrast, it is my understanding that the DW transformers can handle significant input voltage at low frequencies without core saturation.
You mentioned previously that some of your measurement were taken using a Radio Shack SPL meter microphone. I know you also mentioned using some calibration data, but I recently stumbled on some comparisons with the RS mic and its HF roll if did appear similar to what you were showing. Perhaps it is part of the answer to your question about the falling top octave response you were seeing when measuring your ESL tweeter panels.
RealTraps - Measuring Microphones
Attachments
Last edited:
Bolserst -
Once again, many thanks in-depth help.
And again, apologies readers for screwed-up measurements heretofore. Below are curves that suggest curved ESL arrays may not be seriously problematic. However, collecting a bunch of inconsistent measurements today suggests to me that some careful attention needs to be paid to the issues when ESLs are curved or segmented.
Ummm, looks like I should have tossed my Radio Shack analog SPL meter long ago. Results with Dayton EMM-6 vastly nicer than RS north of 8 kHz. (Took a week or so on Toronto Kijiji to get a phantom supply for mic, but there are lots of Behringer mixers out there for sale if you are hesitating buying an electret mic, as I did. Or need something for karaoke. They seem durable enough for our purposes second-hand and performance OK for measurement purposes (which paradoxically aren't as stringent as they would be for listening). Xenyx 1204 for c$70.)
I want to be sure what is the signal output by the tweeter Thordarson transformers to the tweeter array before posting much more acoustic measurements; there are various tweak components in the circuit (developed 30 yrs ago) whose purposes have been forgotten.
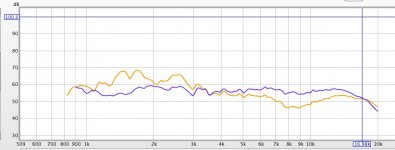
But purely for scientific interest (and to boast a bit), the curve below in orange is the sound at my chair (about 70 inches from the tweeters) with the EMM-6 mic, flat signal to tweeter interface box, just the Dennesen tweeters playing full-range. The blue curve includes the Dayton-Wright mid-range (with crossover around 2.8 kHz) and the DSP EQ I've been using the past few months, 1/12 smoothing. Ahem, ahem, roughly keeps +/- 3 dB, 900-16,000 (on a good day).
At 39 lbs each, a pair of DW transformers in a DW heavy iron box have enough low frequency iron to give a man a hernia. The speakers churn out lots of bass, still rumbling at 50 Hz... but hard to assess a dipole woofer. If there's a thread on the subject, I'll provide some inspirational measurements, if I can.
Ben
Once again, many thanks in-depth help.
And again, apologies readers for screwed-up measurements heretofore. Below are curves that suggest curved ESL arrays may not be seriously problematic. However, collecting a bunch of inconsistent measurements today suggests to me that some careful attention needs to be paid to the issues when ESLs are curved or segmented.
Ummm, looks like I should have tossed my Radio Shack analog SPL meter long ago. Results with Dayton EMM-6 vastly nicer than RS north of 8 kHz. (Took a week or so on Toronto Kijiji to get a phantom supply for mic, but there are lots of Behringer mixers out there for sale if you are hesitating buying an electret mic, as I did. Or need something for karaoke. They seem durable enough for our purposes second-hand and performance OK for measurement purposes (which paradoxically aren't as stringent as they would be for listening). Xenyx 1204 for c$70.)
I want to be sure what is the signal output by the tweeter Thordarson transformers to the tweeter array before posting much more acoustic measurements; there are various tweak components in the circuit (developed 30 yrs ago) whose purposes have been forgotten.
But purely for scientific interest (and to boast a bit), the curve below in orange is the sound at my chair (about 70 inches from the tweeters) with the EMM-6 mic, flat signal to tweeter interface box, just the Dennesen tweeters playing full-range. The blue curve includes the Dayton-Wright mid-range (with crossover around 2.8 kHz) and the DSP EQ I've been using the past few months, 1/12 smoothing. Ahem, ahem, roughly keeps +/- 3 dB, 900-16,000 (on a good day).
At 39 lbs each, a pair of DW transformers in a DW heavy iron box have enough low frequency iron to give a man a hernia. The speakers churn out lots of bass, still rumbling at 50 Hz... but hard to assess a dipole woofer. If there's a thread on the subject, I'll provide some inspirational measurements, if I can.
Ben
Attachments
Last edited:
In case anybody is interested, bentoronto had previously posted near field measurements of his DW ESLs here:
http://www.diyaudio.com/forums/planars-exotics/181725-dayton-wright-xg-10-a.html#post2444969
http://www.diyaudio.com/forums/planars-exotics/181725-dayton-wright-xg-10-a.html#post2444969
In case anybody is interested, bentoronto had previously posted near field measurements of his DW ESLs here:
http://www.diyaudio.com/forums/planars-exotics/181725-dayton-wright-xg-10-a.html#post2444969
Yup. These curves are with a Radio Shack SPL meter (with rough RS calibration used in REW). No EQ tweaking, I believe. But big dipoles in a small room.
Anybody seen a scary horror movie recently? I had a horror experience recently using headphones. I was listening to my Dayton EMM-6 mic set-up at my listening chair, as per usual measurements, and comparing it the source music recording on those headphones. (Helps to use a mixer with mic and source on separate inputs.) Dunno how the brain can erase all that echo.
Ben
Last edited:
FRESH DATA
I tested the output of my interface (Thordarson transformer and associated components). I connected an AC VTVM to the plates of my tweeter array (bias off) and fed a flat sweep. The output curve, at about 80 vrms (similar to music playing) with the 4 cells of the array connected was essentially flat from 20 Hz to 1 kHz and then it looked as close as could be to the sound output curve below! I hesitate to affirm too strongly that this is a proper way to measure the transformer output.. may not be.
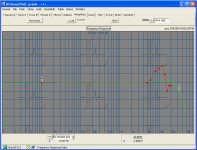
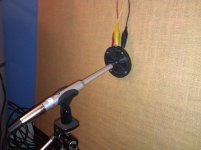
Then, bias back on, I tested a single cell (manufacturer is Dennesen) at one inch; the 4 cells of the array were also playing but at a relatively great distance away (3 feet which was about 20 dB below the single cell by sound measurement). See photo and resulting curve.
(Apparently, the curves for the curved array presented earlier actually did somewhat resemble the signal... now that I can see how the signal from the interface falls off above 1 kHz. Now I'll try to run some better curves for the curved array and post them.)
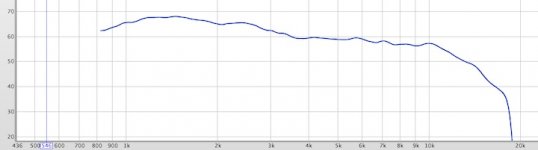
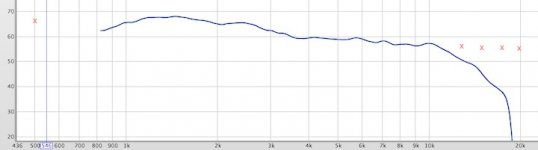
So, a single Dennesen cell will reproduce the freq response of the input signal really closely and to high frequencies.
Ben
I tested the output of my interface (Thordarson transformer and associated components). I connected an AC VTVM to the plates of my tweeter array (bias off) and fed a flat sweep. The output curve, at about 80 vrms (similar to music playing) with the 4 cells of the array connected was essentially flat from 20 Hz to 1 kHz and then it looked as close as could be to the sound output curve below! I hesitate to affirm too strongly that this is a proper way to measure the transformer output.. may not be.
Then, bias back on, I tested a single cell (manufacturer is Dennesen) at one inch; the 4 cells of the array were also playing but at a relatively great distance away (3 feet which was about 20 dB below the single cell by sound measurement). See photo and resulting curve.
(Apparently, the curves for the curved array presented earlier actually did somewhat resemble the signal... now that I can see how the signal from the interface falls off above 1 kHz. Now I'll try to run some better curves for the curved array and post them.)
So, a single Dennesen cell will reproduce the freq response of the input signal really closely and to high frequencies.
Ben
Attachments
Last edited:
In the attached chart, I've added some X's to show how the electrical output of the step-up interface differs from the sound output of a single cell, repeating the chart posted in the previous entry. The two curves are similar 1 kHz to maybe 11 kHz. They differ at the high end although my measurements may be less reliable there.
Ben
Ben
Attachments
Last edited:
- Status
- This old topic is closed. If you want to reopen this topic, contact a moderator using the "Report Post" button.
- Home
- Loudspeakers
- Planars & Exotics
- How to measure high freq in curved panels?