Got this several times recently with the outdated program, but didn't post it as I thought the new version solved it, but apparently not.
Not sure if all were caused the same way, but this one I'd been looking at the response plot, then returned to the INPUT, clicked EDIT, then TOOLs........
New HP probook/win 7 pro that MS keeps trying to upgrade to win 10 via 'updates' even though it came with a free upgrade disc.
GM
Hi GM,
Thanks for the feedback.
The record linked in your post http://www.diyaudio.com/forums/subwoofers/288471-jl-audio-10w6v2-enclosure-design.html#post4649435 works just fine for me. If you would like to send me a copy of your complete Hornresp.dat file I can check to see if anything seems strange in the data. (Click on my name on the Hornresp web page for my email address).
Kind regards,
David
Greets!
OK, though it happened with another file, but it was a different situation. Unfortunately, I'd been doing a lot of back n' forth between three different files, then without thinking I just clicked on the 'error' in a 'knee jerk' response, so being 'bone tired'/'bleary eyed' from lack of sleep I've no clue what the sequence of events was.
GM
edit: YGM
Last edited:
Hi GM,
The good news is that I can find nothing wrong with your Hornresp.dat file - all 70 records contained in the file work just fine for me.
The bad news is that your new system seems to have a compatibility problem with Hornresp
") .
.Kind regards,
David
Was this resolved?
Hi warriorcookie,
Unfortunately, no.
Kind regards,
David
David you sure are busy. Seems like every time I fire up HR I'm behind on updates!
I had a couple of suggestions for future updates. These may have been brought up before so forgive me if they have.
Would it be possible to be able to control the frequency range of the graphs? Most of the time I'm working on bass systems that won't be used past 150Hz at most and much of the graph is devoted to showing 1kHz-20Khz. Even if there was a toggle box or drop down, like the impedance range selections, that would simply switch between standard 10Hz-20kHz and something like 10Hz-500Hz for looking at bass/mid bass systems, that would be great.
Also would it be possible to modify the maximum SPL graph to be able to limit by not only driver excursion and amplifier power, but also amplifier voltage? This is often a very real limitation at the areas of high impedance ad would more realistically predict the systems performance limitations. Often you will see unrealistically high voltages that the amplifier can never supply when using this graph so you have to do a bit of back and forth modeling to start figuring out what areas will be voltage limited versus current or excursion. Alternatively if this is not feasible would it be possible to allow the maximum SPL graph to be captured and overlaid with the normal voltage graph of the same system and vice versa?
Thanks for what you do.
Hi Josh,
This has been requested previously. For a number of reasons which I won't go into unless you really want me to, it's not going to happen.
I must be missing something. Can't this be done already by calculating the normal response then calculating the maximum SPL response and comparing the two by pressing F4? Alternatively, by right-clicking on either of the charts to capture the relevant results for future reference and comparison purposes?
Kind regards,
David
Would it be possible to be able to control the frequency range of the graphs?
This has been requested previously. For a number of reasons which I won't go into unless you really want me to, it's not going to happen
.would it be possible to allow the maximum SPL graph to be captured and overlaid with the normal voltage graph of the same system and vice versa?
I must be missing something
. Can't this be done already by calculating the normal response then calculating the maximum SPL response and comparing the two by pressing F4? Alternatively, by right-clicking on either of the charts to capture the relevant results for future reference and comparison purposes?Kind regards,
David
Dave. You are correct. The info is there but requires 2 traces for one system. What I would like to be able to do is have all of that information on one trace by allowing a user defined voltage as a third limiting factor, that could then be compared directly against that same info from another system. Versus switching records multiple times back and forth. I probably didn't explain very well. Thanks.
What I would like to be able to do is have all of that information on one trace by allowing a user defined voltage as a third limiting factor, that could then be compared directly against that same info from another system.
Hi Josh,
Thanks for the clarification.
It would not be possible for the user-defined amplifier maximum voltage setting to be saved separately as part of the permanent record, and the feature would only be applicable to the main Maximum SPL chart (it would not be available in the Loudspeaker Wizard). As a compromise though, Eg could be made the default value for the amplifier maximum voltage, allowing the user-defined maximum voltage setting to then be saved to the permanent record as Eg, if so desired.
Would this be acceptable?
Kind regards,
David
What I would like to be able to do is have all of that information on one trace by allowing a user defined voltage as a third limiting factor, that could then be compared directly against that same info from another system.
I can't speak for Josh but just having the max voltage feature even without the ability to save the parameter to the record would be OK for me.
Hi Josh and Dan,
I have had a look at what would be required to implement the requested feature. The work that would have to be done to fully integrate the functionality would be considerable, and for that reason I am reluctant to take it on - particularly as the enhanced tool would really only be needed when wanting to directly compare the results of two different records.
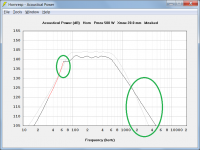
It is of course already possible to observe the effects of voltage limiting for individual records. Using a copy of the Hornresp default record as an example, the process is as follows:
1. Set Eg to the amplifier maximum voltage (assume 100 volts).
2. Calculate the standard power response.
3. Calculate the Maximum SPL response (assume Pmax = 500 W and Xmax = 20 mm).
3. Press F4 to compare results.
Where the red or black trace is higher than the grey trace, the grey trace is the voltage-limited response.
Attachment 1 shows the compared results.
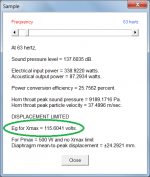
Attachment 2 shows the voltage at 63Hz (115.6 volts).
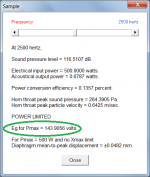
Attachment 3 shows the voltage at 2500Hz (143.9 volts).
The voltage at any frequency can be checked by moving the Sample tool slider. For the given example, the system will be voltage-limited at those frequencies where the sample voltage shown exceeds 100 volts.
In summary then, as you would have guessed by now - it's not going to happen
.Kind regards,
David
Attachments
Error Showing ?
@ David McBean
HR Version 39.70 - Product Number 3970-160223
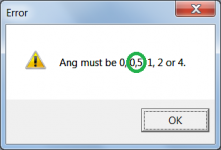
Hi, no big deal, but thought i'd post it anyway as you like to know these things. It won't accept a comma, only a period/dot.
A period/dot is fine with me. I've noticed over the years on other software, mainly from non English speaking coutries, they seem to use commas for some reason ?
@ David McBean
HR Version 39.70 - Product Number 3970-160223
Hi, no big deal, but thought i'd post it anyway as you like to know these things. It won't accept a comma, only a period/dot.
A period/dot is fine with me. I've noticed over the years on other software, mainly from non English speaking coutries, they seem to use commas for some reason ?
Attachments
Not always Easy !
@ David McBean
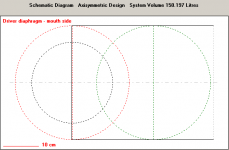
Some people find it difficult transferring what the Schematic Diagram shows for some designs, into an actual real world drawing to be able to even contemplate building ! Sadly, i/m not afraid to admit i'm one of those. Even though i've been successfully designing/building Lots of enclosures over Many years, using R.Small's papers before we had comps & soft.
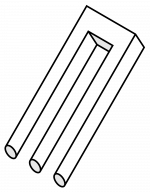
Here's just one example. How would you accurately actually draw this out in 3D on 2D on paper and/or screen ?
@ David McBean
Some people find it difficult transferring what the Schematic Diagram shows for some designs, into an actual real world drawing to be able to even contemplate building ! Sadly, i/m not afraid to admit i'm one of those. Even though i've been successfully designing/building Lots of enclosures over Many years, using R.Small's papers before we had comps & soft.
Here's just one example. How would you accurately actually draw this out in 3D on 2D on paper and/or screen ?
Attachments
@ David McBean
HR Version 39.70 - Product Number 3970-160223
Hi, no big deal, but thought i'd post it anyway as you like to know these things. It won't accept a comma, only a period/dot.
A period/dot is fine with me. I've noticed over the years on other software, mainly from non English speaking coutries, they seem to use commas for some reason ?
Hi Zero D,
Thanks for the feedback.
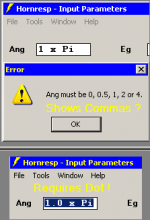
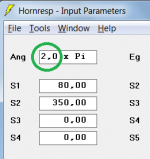
Take a close look at the error message you posted - it reads "Ang must be 0, 0.5, 1, 2 or 4." The commas sit between the numbers, they do not form parts of the numbers themselves. 0.5 is shown with a period as the decimal separator.
The regional setting of your computer is such that a period is the designated decimal separator, which is why commas are not accepted. If you change your regional setting to "French (France)" for example, the error message will read "Ang must be 0, 0,5, 1, 2 or 4." with 0,5 being shown as having a comma as the decimal separator (see Attachment 1). The Ang input box value will then require a comma rather than a period in the number (see Attachment 2).
Kind regards,
David
Attachments
@ David McBeanHow would you accurately actually draw this out in 3D on 2D on paper and/or screen ?
It's not a practical physical design - just because it can be drawn in the form shown, doesn't necessarily mean that it can be built.
Attachments
Hornresp Update 3970-160322
Hi Everyone,
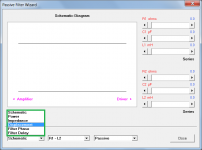
In the last release a change was made to the Filter Wizard tool which prevented group delay or impulse response results from being calculated when either the Passive or Le Cléac'h filter option was selected, and Rg was non-zero (see Attachment 1). This restriction was imposed because the model used to calculate phase contained a small simplification which caused results to become slightly inaccurate when large values of Rg were specified.
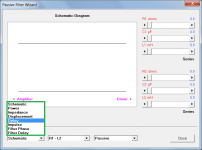
Additional coding has now been added to eliminate the simplification in the model. The phase-dependent group delay and impulse response results remain accurate for all values of Rg and the recently-imposed limitation has been removed so that group delay, group delay per period and impulse response are now calculated under all conditions (see Attachment 2).
Numerous other changes have also been made to further "tidy up" the operation of the Filter Wizard tool.
Kind regards,
David
Hi Everyone,
In the last release a change was made to the Filter Wizard tool which prevented group delay or impulse response results from being calculated when either the Passive or Le Cléac'h filter option was selected, and Rg was non-zero (see Attachment 1). This restriction was imposed because the model used to calculate phase contained a small simplification which caused results to become slightly inaccurate when large values of Rg were specified.
Additional coding has now been added to eliminate the simplification in the model. The phase-dependent group delay and impulse response results remain accurate for all values of Rg and the recently-imposed limitation has been removed so that group delay, group delay per period and impulse response are now calculated under all conditions (see Attachment 2).
Numerous other changes have also been made to further "tidy up" the operation of the Filter Wizard tool.
Kind regards,
David
Attachments
Thanx! I love it!
Hi Sabbelbacke,
Not a problem, glad you like it
.It was bugging me that the group delay and impulse response results couldn't be included under certain conditions - I had to do something about it!
Kaizen - continuous improvement
.Kind regards,
David
- Home
- Loudspeakers
- Subwoofers
- Hornresp