Hi David,
Rane has some nice papers on filters, one is on the Bessel filter: A Bessel Filter Crossover, and Its Relation to Others .
Regards,
Rane has some nice papers on filters, one is on the Bessel filter: A Bessel Filter Crossover, and Its Relation to Others .
Regards,
the coef for all the traditional filter types exist...........The first order filter is only Butterworth. You can't vary the Q on the first order filter.
I do not know the coefficients for higher order Bessel, or even if they exist.
As far as I'm concerned the standard single pole RC or CR filter is a Butterworth with a Q=Sqrt(2).
Some have said I am wrong, but I just left them believing I'm the fool.
Hi David,
I hope I didn't open too much of a can of worms for you, but I now understand a little more about using Hornresp and Jeff's software.
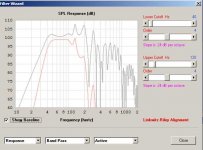
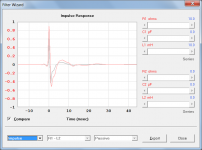
One question that comes up when using the Filter Wizard is: is it possible to add a button to the Filter Wizard that transports the filtered SPL curve into the main window, so that the filtered SPL curve can be used as the basis for impulse and group delay graphs? I'll attach a typical Filter Wizard window as an example.
Either way, thank you so much for your continued effort, and for making Hornresp such a wonderful tool.
Regards,
I hope I didn't open too much of a can of worms for you, but I now understand a little more about using Hornresp and Jeff's software.
One question that comes up when using the Filter Wizard is: is it possible to add a button to the Filter Wizard that transports the filtered SPL curve into the main window, so that the filtered SPL curve can be used as the basis for impulse and group delay graphs? I'll attach a typical Filter Wizard window as an example.
Either way, thank you so much for your continued effort, and for making Hornresp such a wonderful tool.
Regards,
Attachments
Phi = -ATAN2 (X,Y)
Hi Jeff,
Just to clarify - am I correct in assuming that you actually meant to say Phi = ATAN2 (-X,Y)?
Kind regards,
David
Hi Oliver,
Unfortunately from an operational perspective that would complicate things greatly for me. As far as the Filter Wizard itself is concerned though, I hope in the next release to include three additional active filter charts showing filter phase shift, filter group delay and overall filter plus speaker group delay - all results calculated in real time.
Kind regards,
David
is it possible to add a button to the Filter Wizard that transports the filtered SPL curve into the main window, so that the filtered SPL curve can be used as the basis for impulse and group delay graphs?
Unfortunately from an operational perspective that would complicate things greatly for me. As far as the Filter Wizard itself is concerned though, I hope in the next release to include three additional active filter charts showing filter phase shift, filter group delay and overall filter plus speaker group delay - all results calculated in real time.
Kind regards,
David
Last edited:
Hi Jeff,
Just to clarify - am I correct in assuming that you actually meant to say Phi = ATAN2 (-X,Y)?
Kind regards,
David
No, the way I wrote it is the way it is used in Excel. However, there are several things in Excel that are quirky, like needing to convert to Radians. I'm not sure if the way you wrote it would yield the correct result, but it would be easy enough to test and see.
I'm not sure if the way you wrote it would yield the correct result, but it would be easy enough to test and see.
Hi Jeff,
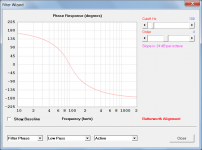
For a 4th-order Butterworth low-pass filter with a cutoff frequency of 100 Hz:
Phi = ATAN2 (-X,Y) gives the result shown in Attachment 1.
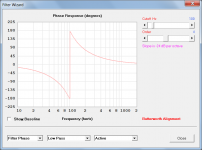
Phi = -ATAN2 (X,Y) gives the result shown in Attachment 2.
Phi = ATAN2 (-X,Y) removes the phase wrapping at 100 Hz, but shows the phase starting at 180 deg rather than at 0 deg. I have noticed that this "unwrapped" presentation often seems to be the format of choice, which is why I sought the clarification. It makes no difference to the group delay results of course, which way the phase is calculated.
Kind regards,
David
Attachments
Last edited:
Hi Jeff,
For a 4th-order Butterworth low-pass filter with a cutoff frequency of 100 Hz:
Phi = ATAN2 (-X,Y) gives the result shown in Attachment 1.
Phi = -ATAN2 (X,Y) gives the result shown in Attachment 2.
Phi = ATAN2 (-X,Y) removes the phase wrapping at 100 Hz, but shows the phase starting at 180 deg rather than at 0 deg. I have noticed that this "unwrapped" presentation often seems to be the format of choice, which is why I sought the clarification. It makes no difference to the group delay results of course, which way the phase is calculated.
Kind regards,
David
I am not sure what you mean by format of choice, but attachment 2 (-ATAN2 (X,Y) is the correct phase. For a 4th order slope the phase should be at 180 degrees at Fc and wrap at that point. Attachment 1 is not correct.
Hi David,
Post #3606: "...I hope in the next release to include three additional active filter charts showing filter phase shift, filter group delay and overall filter plus speaker group delay - all results calculated in real time."
Looking very much forward to that. Thanks,
Regards,
Post #3606: "...I hope in the next release to include three additional active filter charts showing filter phase shift, filter group delay and overall filter plus speaker group delay - all results calculated in real time."
Looking very much forward to that. Thanks,
Regards,
I am not sure what you mean by format of choice, but attachment 2 (-ATAN2 (X,Y) is the correct phase. For a 4th order slope the phase should be at 180 degrees at Fc and wrap at that point. Attachment 1 is not correct.
Hi Jeff,
Thanks for the clarification.
By format of choice I had meant that the phase is often shown unwrapped, without the discontinuity at 180 degrees. I had assumed that this was done simply to make the chart look "neater". What had me puzzled though, was that intuitively, the phase shift at 0 Hz should have been 0 deg, not 180 deg - which is consistent with what you are saying.
On re-checking more carefully, I now see that the charts showing unwrapped phase are using the range 0 deg to -360 deg rather than +180 deg to -180 deg, which explains everything
") .
.Thanks again for sorting this out for me - I will definitely use -ATAN2 (X,Y) in Hornresp!
I think I am making progress, although it can be painfully slow for me sometimes...
.Kind regards,
David
Looking very much forward to that. Thanks,
Hi Oliver,
Not sure how long it will take - I am very busy at the moment.
In my spare time I have been thinking some more about your impulse response request - I can't resist a challenge
. It's early days yet, but I am hoping that it might be possible to do something within the Filter Wizard itself, and to therefore avoid the operational complications inherent in transferring filtered SPL and phase data back to the main window, and processing it there.I will keep you posted on any progress...
Kind regards,
David
Hi David
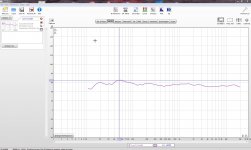
I have done the T-TQWT, well, it is a success, close to what predicted, hmm, a church organ do all the octaves, that is a real experience, the sub is there when needed and gone when not.
I do use it together with open baffles, it match very good.
The bumps are not of the box, that is a error because of grid (50Hz) problems.
I am building a mic who has this anymore (batteries)
regards
kees
Attachments
Last edited:
I have done the T-TQWT, well, it is a success, close to what predicted,
Hi Kees,
Thanks for the feedback on your project. Pleased to hear that measured results are close to simulation predictions
.Kind regards,
David
I will keep you posted on any progress...
Hi Oliver,
Just confirming that the next release of Hornresp will be able to calculate the impulse response of the combined filter plus speaker system, as requested.
Kind regards,
David
Attachments
- Home
- Loudspeakers
- Subwoofers
- Hornresp