I'm sorry if this has been covered.
I have some problems with phase meassurment. To make things simpler i have made a lowpass filter of an inducter and a resistor. L = 850uH and R = 5.6 F3 around 1Khz
The phase shown at 1Khz is about -15 degrees. It never gets bigger than -36 degrees and about 2 Khz it start to go positive again being 0 degrees at 7 Khz.
Finally being +170 degrees at 20Khz.
Am I an idiot or is there something wrong.
The absolute phase depends on what is called "time zero" this can be adjusted in Holm and if done automatically it does not always find the proper zero. Go and adjust the time zero by small amounts and you will see the phase change. At some point it should be close to reality and this is the 'true" time zero.
Yep, what Earl says.
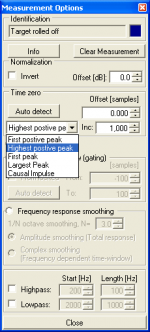
There are several ways for HOLM to find "time zero". It can be don automatically with the measurement, or after the fact in the Options button of each measurement. See below.
Highest Positive peak usually works best. Chose one of the methods from the drop down and click on "auto Detect". You may have to invert your measurement good results if the impulse is mostly negative going.
Attachments
This is a good time to ask this question.
Causal Impulse gives me much more phase rotation, especially in the HF. Is that real? I'm comparing it to Largest Peak, which works for both positive and negative going impulses. There is not much explanation of the Causal Impulse time zeroing in the manual. Can someone explain the difference?
Causal Impulse gives me much more phase rotation, especially in the HF. Is that real? I'm comparing it to Largest Peak, which works for both positive and negative going impulses. There is not much explanation of the Causal Impulse time zeroing in the manual. Can someone explain the difference?
Time zero is a question of definition and what your're looking for. Causal just means the phase reference point should be right at where the output signal first starts, emerging from the noise floor.
Oftentimes more useful is to use the center of high freq signal components ("largest peak" with any normal speaker/driver) as the time zero because this minimizes phase wrap at HF.
You can find the zero delay point for HF by converting the whole signal to minphase externally, reload it and try match HF phase rolloff of the original pulse to it, at least overall rolloff behaviour, and if you can't get a in-detail match you also know your HF is not minimum phase (in the sense that it is plagued by very early reflections, mathematically it is still minimum phase unless the echo pulse/s is/are exact same shape AND level as the primary pulse).
Last edited:
The problem is for HF we know that the phase must roll off corrsponding to the rolloff of magnitude shape, but we don't know how much in detail. We know that a speaker cannot have a phase going more positive while the response falls at the same time with the correct time zero, as well we know that the phase cannot roll off negative like crazy when we see a moderate response rolloff. So we can only eyeball correct time zero (much easier to see a dead-time related rolloff in linear frequency scale, btw, as it becomes a superimposed slope on the real phase response). Only way to find the exact point (for academic interest, that is) is to covert to minphase which makes the HF start at the first sample, reload it without auto zero detection and move the original pulse in time in 1/10th sample fractions until you see the same rolloff at HF. Largest or first peak is typically very close so that should do in most situations.
Example of the "linear view eyeballing" here : http://www.diyaudio.com/forums/mult...rns-no-drawbacks-no-issues-6.html#post3636875
Example of the "linear view eyeballing" here : http://www.diyaudio.com/forums/mult...rns-no-drawbacks-no-issues-6.html#post3636875
Last edited:
Thanks KSTR... I think I understand.
Earl,
http://www.diyaudio.com/forums/mult...hase-linearization-eq-fir-filtering-tool.html
Allows you to play with phase and output corrected impulse that can be inserted in the signal chain to fix phase (and other things).
Earl,
http://www.diyaudio.com/forums/mult...hase-linearization-eq-fir-filtering-tool.html
Allows you to play with phase and output corrected impulse that can be inserted in the signal chain to fix phase (and other things).


I find if you look at the highest frequencies while changing the start time, it will be easier to find where they aren't rolling upward or downward. Phase doesn't have to be level, just free of this extra shift.
An exception to this is where you are taking two measurements from one location. Then you can choose which one will be the 'correct' one.
An exception to this is where you are taking two measurements from one location. Then you can choose which one will be the 'correct' one.
Causal means no output commences before the stimulus input. (Drivers are not clairvoyent!).
If we consider most drivers to be bandpasses (limited bandwidth with rolloffs both sides) then we will always see the phase roll up on the low side and roll down on the high side. All we need is to figure out the magnitude of the longest delay on the high side. With the "t equals minus d phi over d omega" understanding then the right delay gets the stop band phase to bend up to just level ( which will equal zero delay for that frequency region).
This would be equivalent to creating the group delay curve ( calculating the d phi d omega curve) and looking for the earliest part and then setting it to zero ms.
This should also be the delay required to get the measured phase to match calculated minimum phase.
It isn't quite the first peak in the impulse response, as energy preceeds that. I believe the peak of the impulse is roughly equal to the group delay of the center of the unit's band pass. Note that I have seen designers attempt time allignment by setting the impulse peaks of several sections in line. This gets their respective midbands in allignment but very likely gets their crossover region out of phase. Wrong!
My understanding, at least.
David
I nead help understanding measurments
I'm using
- pc - behringer DCX2496 - amplifiers - speaker
- mic / behringer - monacor micpriamp - pc
cut is 12db L-R at 2.4kHz
what I don't understand is why is ti measure low frequencies on twitter ?
and have high on mid bas ?
is there something I'm doing wrong ?
( pc audio card have flat response )
this is with 1/6 smoothing
Last edited:
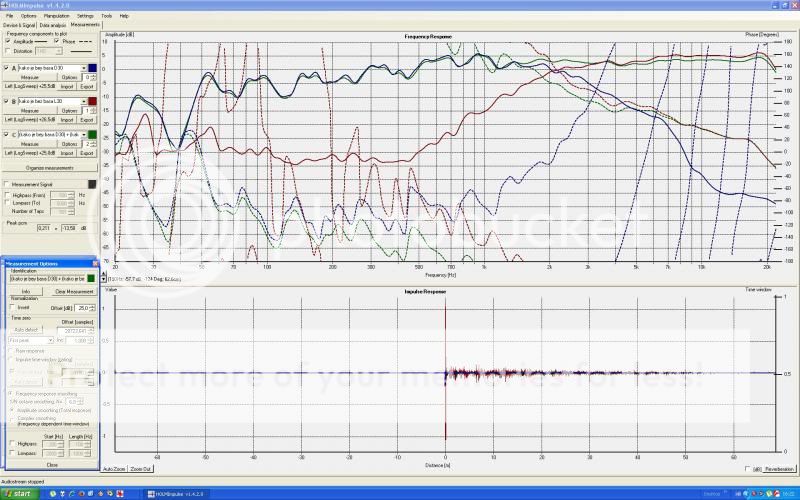
Here is the frequency response of mid/bas with twitter (green)
with 1/6 smoothing
How does it look to you ?
I think it's bad, because all those up and down under 1kHz
Is it room or just a bad speaker cabinet ?
(drivers are scan speak 18W8545)
or is there some holmi user guide how to measure for dummies ?
(practical stap by stap..I have searc net and this is the simple one...
Red Spade Audio: How to measure your crossover with Holm Impulse
In those grafs I didn't use gating ?
would that help ?
...
what I don't understand is why is ti measure low frequencies on twitter ?
and have high on mid bas ?
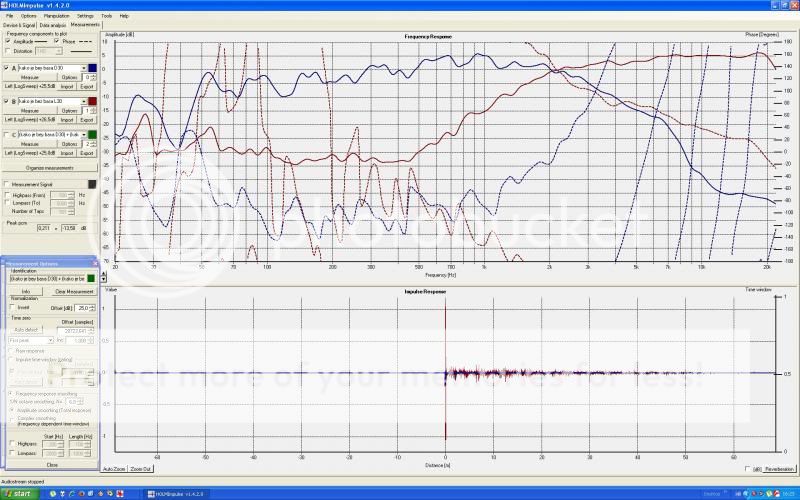
Once the SPL reaches the noise floor (550 Hz for the TW and maybe 40 Hz for the MW) the SPL response follows the noise floor and the phase response will go wild.
It's a good idea to measure the noise floor so you can understand where it is.
In "Options" there is ability to hide the phase when SPL falls below a level you can set. This can help clean up the traces if it is set correctly.
The MW trace has the phase rolling up at a fast rate. This is due to the position of its IR relative to 0 ms. Its peak must be before 0 ms.
...I think it's bad, because all those up and down under 1kHz
Is it room or just a bad speaker cabinet ??
This is typical room influence.
If you can't find detailed info regarding Holm try reading the info provided on any other measurement software package. The concepts are all identical and once those are understood then it is easy to learn how to use the controls provided in Holm.
- Home
- Design & Build
- Software Tools
- HOLMImpulse: Measuring Frequency & Impulse Response