What is that ? - link/definition/picture/graph/exampleFerrit37 said:while were asking for features, how about a coherence trace?
askbojesen said:
What is that ? - link/definition/picture/graph/example
I think he means coherence in standard usage in signal processing as the amount of the output signal that is coherent or linearly related to the input signal. This can only be obtained with two channel data (which I have suggested before myself). It is defined as the magnitude squared of the cross spectrum divided by the input and output autospectra. If it is 1.0 then the entire output comes from the input. Noise and nonlinearities will lower the value from 1.0.
Well not so much "two channel data" as at least two measurements, there's a formal definition here, though it is as Earl has stated: http://zone.ni.com/devzone/cda/tut/p/id/4278
JohnPM said:Well not so much "two channel data" as at least two measurements
Whats the difference
 ?
?Maybe the difference is just whether the measurments are made at the same time or one after the other?
When I read "two channel" I thnk 2 at the same time. But of course it doesn't have to mean that - and you probably didn't.
Agree that the Coherence Function would be a nice touch.
When I read "two channel" I thnk 2 at the same time. But of course it doesn't have to mean that - and you probably didn't.
Agree that the Coherence Function would be a nice touch.
To do coherance on data taken at different times would be difficult and I would not trust the results, so yes, I meant two simultaneous channels as otherwise the coherance is not going to be very useful. I know of no applications of coherance that do not use simultaneous data, although I suppose that you could hypothesize doing on seperate data. I'd need to see an analysis of the noise and nonlinearities in that situation however.
If I had to guess at what would be different when taking two samples at two different times but on the same I/O chain. If there is jitter in the clock. I would think those irregularities are what would be picked up/exposed.
I am having a hard time wrapping my head around this concept though how would it be different from an inverse cancellation test?
I am having a hard time wrapping my head around this concept though how would it be different from an inverse cancellation test?
Key said:If I had to guess at what would be different when taking two samples at two different times but on the same I/O chain. If there is jitter in the clock. I would think those irregularities are what would be picked up/exposed.
I am having a hard time wrapping my head around this concept though how would it be different from an inverse cancellation test?
I would expect any time varient errors to be a problem when the two data set were not taken at the same time. This would include any random errors or random noise, which, by deffinition, would be time varient. These would probably be taken as "incoherent" when in fact they may propagate through the system and be a coherent signal. I would expect a lower coherence from non-simultaneous data than is really the case.
Well yeah, that makes sense. I was a little surprised by - and maybe didn't understand - the NI page linked to:
I took this to mean that several passes were needed, not simulations measurements. Yes/No?
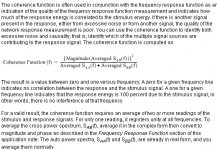
For a valid result, the coherence function requires an average of two or more readings of the stimulus and response signals.
I took this to mean that several passes were needed, not simulations measurements. Yes/No?
Ahh Sorry,
Coherence function is exactly as Earl Geddes explained - a correlation of two signals, basically its a Quality of data value between 0 and 1 (or 0-100%) for each frequency. This value is determined by the following questions -
1. Was there enough energy in the reference signal (send) to make a valid measurement?
2. Was there enough energy in the measurement signal (return) to make a valid measurement?
3. Are the two signals aligned in time?
4. Did the signal change in a non linear way ? (fom input to output)
5. is there too much noise in the signal? (direct to reverberation)
This can make Coherence a pretty useful item.
It is critical to note that just because there is Low coherence, it does not mean that the data is wrong! - there are many cases where the coherence is low but the data is accurate - such as a dip in the frequency response due to a polarity inversion between drivers or a cancellation due to a reflection. In both cases the coherence would be low and the data correct. It does take some skill in reading the data but useful nontheless.
Some measurement systems also use coherence with Magnitude Blanking, turning off the low coherence parts of the trace if it drops below a certain percentage, say 10% or so. Coherence averaging of multiple traces, only averaging the "good bits", has also been tried, still not sure on this one though.
hope this helps
In the context of acoustic measurement systems I do not know of any that do not use multiple successive averages of measurements to generate the coherence function, that is how it is defined, from the early dual channel FFT analysers. Perhaps we are talking at cross purposes and you are referring to the simultaneous capture of each stimulus and each response in the multiple successive sets that are subsequently averaged? It is precisely the fact that the multiple sets are not taken at the same instant that allows the non-coherent noise contributions to be distinguished. The coherence function collapses to unity for a single measurement set, as can be seen from the definition in the NI article.gedlee said:To do coherance on data taken at different times would be difficult and I would not trust the results, so yes, I meant two simultaneous channels as otherwise the coherance is not going to be very useful. I know of no applications of coherance that do not use simultaneous data, although I suppose that you could hypothesize doing on seperate data. I'd need to see an analysis of the noise and nonlinearities in that situation however.
Hey John,
As you say multiple averages are used to help eliminate "noise" from the measurement by almost all Dual FFT systems.
And as you say its the simultaneous capture of successive sets that are subsequently averaged, not a single set.
For instance in Smaart you can set the averages to different values, at a setting of 1 the traces dance all over the place in a noisy enviroment, set the averages to 32 and you get a stable trace but you have to "flush" the FIFO registers to see changes, or wait.
You can see Coherence fall if someone talks near the mic during low level measurements.
Re: Coherence Function
Did you follow the NI link? Coherence only has meaning in the context of averaging multiple measurements. It was a valuable measure in the days of dual channel FFT analysers with random noise stimuli (or when using music as a stimulus) as it would highlight unreliable areas of the measurement where the stimulus for a particular set of averages might have low energy or the response is dominated by noise. I don't personally feel it is of much benefit nowadays - with sweeps the stimulus energy is high for all measurements and a long single sweep is usually better than multiple shorter sweeps, while even for noise stimuli a periodic noise stimulus (rather than the random noise of old) will have guaranteed uniform energy distribution in each measurement even without averaging so little need for the coherence indicator.askbojesen said:The formulas can't be that complicated
ok let
X(f) = FFT( Signal ) (logsweep)
Y(f) = FFT( Recording )
H(f) = Y(f)/X(f) = Frequency response
What is then the Coherence Function ?
Attachments
Hi Askbojesen,
I can't lay the exact function out for you but the Coherence chapter in the NI doc lays it all out for you.
http://zone.ni.com/devzone/cda/tut/p/id/4278
hope this helps, I have to say your program is Very good and the development time is staggering, I'm used to two to six months between versions.
Keep at it!
ARTA can plot coherence vs. frequency but only in 2-channel RTA mode. Ivo only recommends using it with a signal like continuous pink noise and where several measurements are being averaged. The idea is the signal is different for each of the measurements being averaged so it checks to see if input/output is the same for each of them. If it is, the coherence is 1.
He doesn't consider it necessary with a better 2-channel RTA signal like periodic noise because the signal is the same for each measurement. The same holds for signals used to generate an impulse response -- periodic noise, swept sine or MLS -- the signal is identical each time it plays so a coherence calc isn't needed.
He doesn't consider it necessary with a better 2-channel RTA signal like periodic noise because the signal is the same for each measurement. The same holds for signals used to generate an impulse response -- periodic noise, swept sine or MLS -- the signal is identical each time it plays so a coherence calc isn't needed.
Re: Coherence Function
First, you can't just use H(f) simply defined that way because it won't work, the equations will just simplify down to 1 = 1.
let Sxy(f) = the cross spectrum of x(t) and y(t)
and Sxx(f) = the auto spectrum of x(t)
and Syy(f) = the auto spectrum of y(t)
Then gamma(f) = sqr(|Sxy(f)|^2 / ( Sxx(f) * Syy(f)))
Because you don't do cross spectrum directly in your software you don't have Sxy(f). You can get Sxy(f) from X(f) *conjg(Y(f))
and but then
gamma(f) = sqrt( X(f) * conjg(Y(f)) * conjg(X(f)) * Y(f)) / (X(f) * conjg(X(f)) * Y(f) * Conjg(Y(f)))
which simplifes to one unless you do "expected value" of each operation over a number of data records to calculate the auto and cross spectra and THEN calculate the coherence. With only one data set the coherence is always one.
What I meant of two channels versus two measurements is that you can't really do one data set (channel), wait a period of time and then do another data set because the time vary error will mess things up. WHen we average over mant data sets in a measurement we have assumed time-invarince across those daa sets, ie. Stochastic data. The longer the time interval the less valid this assumption will tend to be.
askbojesen said:The formulas can't be that complicated
ok let
X(f) = FFT( Signal ) (logsweep)
Y(f) = FFT( Recording )
H(f) = Y(f)/X(f) = Frequency response
What is then the Coherence Function ?
First, you can't just use H(f) simply defined that way because it won't work, the equations will just simplify down to 1 = 1.
let Sxy(f) = the cross spectrum of x(t) and y(t)
and Sxx(f) = the auto spectrum of x(t)
and Syy(f) = the auto spectrum of y(t)
Then gamma(f) = sqr(|Sxy(f)|^2 / ( Sxx(f) * Syy(f)))
Because you don't do cross spectrum directly in your software you don't have Sxy(f). You can get Sxy(f) from X(f) *conjg(Y(f))
and but then
gamma(f) = sqrt( X(f) * conjg(Y(f)) * conjg(X(f)) * Y(f)) / (X(f) * conjg(X(f)) * Y(f) * Conjg(Y(f)))
which simplifes to one unless you do "expected value" of each operation over a number of data records to calculate the auto and cross spectra and THEN calculate the coherence. With only one data set the coherence is always one.
What I meant of two channels versus two measurements is that you can't really do one data set (channel), wait a period of time and then do another data set because the time vary error will mess things up. WHen we average over mant data sets in a measurement we have assumed time-invarince across those daa sets, ie. Stochastic data. The longer the time interval the less valid this assumption will tend to be.
Hey Earl,
Seeing broad drops in the Coherence trace, especially at the higher frequencies, is one of the first clues that the delay for synchronization of the two signals is "out" in a "live" trace measurement. The High freq's being the shortest, are the most sensitive to timing errors.
As I said early just because Coherence is Low doesn't mean the data is wrong but add the stuff going on in the phase trace and you start to get clues. This is all valuable stuff in live measurements, but might not be that important in speaker measurements.
- Home
- Design & Build
- Software Tools
- HOLMImpulse: Measuring Frequency & Impulse Response