The earlier Octave versions installation packages can be found here:
ftp://ftp.gnu.org/pub/gnu/octave/
- Elias
ftp://ftp.gnu.org/pub/gnu/octave/
- Elias
Hi,
I'm using Octave 3.0.3 and GnuPlot 4.3.
How does your pcolor plot looks like with your version if you run the waveletdemo.m?
An externally hosted image should be here but it was not working when we last tested it.
- Elias
Mine look pretty different anyway :

I use :
octave 3_2
qtoctave 0_8_2
GNU-Plot 4_2_6_1
I would not mind about the very different general scaling (easy to fix) – but the tics on the axis are missing too
The earlier Octave versions installation packages can be found here:
ftp://ftp.gnu.org/pub/gnu/octave/
- Elias
Thanks Elias, I'm gonna check out the old Octave version for this...
#############
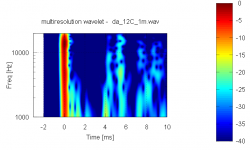
When working towards multi-resolution feature I found a "bug" that is not so obvious when only using the normalized plots of the DIY WTF package (hence I have seen it so late).
A closer inspection of the *un-normalized* plots did show however that the Lewalle code performs different.
My guess is that Jaques Lewalle was aiming for a certain look of the wavelet that is not necessarily a liner representation of the time frequency behaviour we are after.
Anyway – I already found part of what's the roots, but certainly could need some input / help to make it perfect.
Elias, your artificial IR file containing subsequent impulses is ideal to check out the package behaviour. Again thanks for that !
Below is what we get from version 1.0 (non - normalized) :

And here is what we get form latest version 1.1 (non - normalized) :

We see in the plot above, that the non-linear frequency response is now corrected in version 1.1, but there is still an issue in that the time versus frequency resolution isn't constant over the frequency range.
Meaning – for a certain wavelet scaling I get different resolution depending on frequency.
It is easily seen that around 1kHz there is mainly frequency preference resolution where as higher up there is time preference resolution.
IMO this is written somewhere in the "lewa_mymorlet" code here – but I didn't got around it yet:
Code:
function [wtf_mag] = lewa_mymorlet (xh,ff,kf, wtf_scale,d_bug)
														% xh: DFFT of signal
														% ff: vector of frequencies (linear)
														% kf: vector of frequencies (logarithmic)
														% z0: parameter
														% yn: norm of Morlet transform arrays
 %--------------------------------------------------------
%	 lewa_mymorlet
%--------------------------------------------------------
%	This file is part of Diy_Audio_WTF package, intended to get started on Audio Wavelet Transformation
%	on free Octave software
%	Copyright (C) J. Lewalle  1995
%	rewritten by Michael Gerstgrasser 2010
%
%	"lewa_mymorlet" is a function for Morlet wavelet  trasnform of a signal
%
%	Input variables :
%	d_bug 		is for providing additional information in case of debug mode
%
%
%
%
%	see also :
%	start_wavelet.m, load_arta_txt_ir.m, load_ascii_ir.m, load_ascii1_ir.m,
%	load_wav_ir.m, shape_ir.m, matrix_norm.m, wtf_mag_norm.m, wtf_lecleach.m,
%	wtf_morlet_lewalle.m,  lewa_fftfreq.m, lewa_mymorlet.m, waveletdemo.m, content.m,
%
%	Contributing authors to the Diy_Audio_WTF package in order of code publishing date:
%
%	Michael Gerstgrasser 	- Contact information:  user 'mige0' at www.diyaudio.com
%	Elias Pekonen 		- Contact information:  user 'Elias' at www.diyaudio.com
%	Jacques Lewalle  	- http://www.ecs.syr.edu/faculty/lewalle/
%	Jean-Michel Le Clac'h	- Contact information:  user 'Jmmlc' at www.diyaudio.com
%
%
% 	Diy_Audio_WTF  (Wavelet Audio Analysis) package free software; you can redistribute it and/or modify it
% 	under the terms of the GNU General Public License as published by the
% 	Free Software Foundation; either version 2, or (at your option) any
% 	later version.
%
%
% 	check out on www.diyaudio.com :
%	"Help on making MULTIRESOLUTION WAVELET ANALYSIS available ?"
%	http://www.diyaudio.com/forums/software-tools/163473-help-making-multiresolution-wavelet-analysis-available.html
%	"WTF!? Wavelet TransForm for audio measurements - What-is? and How-to?"
%	http://www.diyaudio.com/forums/multi-way/164029-wtf-wavelet-transform-audio-measurements-what-how.html
%	"Horn Honk $$ WANTED $$"
%	http://www.diyaudio.com/forums/multi-way/161627-horn-honk-wanted.html
%
%
% 	Diy_Audio_WTF is distributed in the hope that it will be useful, but WITHOUT
% 	ANY WARRANTY; without even the implied warranty of MERCHANTABILITY or
% 	FITNESS FOR A PARTICULAR PURPOSE.  See the GNU General Public License
% 	for more details.
%
% 	You should have received a copy of the GNU General Public License
% 	along with Diy_WAA; see the file COPYING.  If not, write to the Free
% 	Software Foundation, 675 Mass Ave, Cambridge, MA 02139, USA.
%
%--------------------------------------------------------

 if d_bug == 1;
	disp ("DEBUG REPORT: processing function :  lewa_mymorlet , please WAIT !" )
endif


 n=length(xh);
 ns=length(kf);

sq2pi = sqrt(2*pi);
z0 = wtf_scale;												% variable for time / frequency trade off

    for is=1:ns
  	for ii=1:n
  		z=ff(ii)/kf(is);
  		morh(ii)= z0/kf(is)/sq2pi * (exp(-(z0^2*(1-z)^2)/2) - exp(-z0^2*(1+z^2)/2) );
											      				% morh(ii) = morh(ii) * kf(is)/sqrt(cps) ;% my scaling
    	endfor
    	for ii=1:n ;
    		yh(ii) = xh(ii)*morh(ii);
    	endfor
    	ycmor(is,:) = ifft(yh); 										% the complex inverse transform
  end
  wtf_mag = abs(ycmor); 										% its norm


if d_bug == 1;
	disp ("DEBUG REPORT: function :  lewa_mymorlet processed successfully" )
endif


 endfunction
The part that looks interesting for me is this one where the wavlet variable comes into play:
Code:
z0 = wtf_scale;												% variable for time / frequency trade off

    for is=1:ns
  	for ii=1:n
  		z=ff(ii)/kf(is);
  		morh(ii)= z0/kf(is)/sq2pi * (exp(-(z0^2*(1-z)^2)/2) - exp(-z0^2*(1+z^2)/2) );
											      				% morh(ii) = morh(ii) * kf(is)/sqrt(cps) ;% my scaling
    	endfor
    	for ii=1:n ;
    		yh(ii) = xh(ii)*morh(ii);
    	endfor
    	ycmor(is,:) = ifft(yh); 										% the complex inverse transform
  end
My half educated guess is that the wavelet isn't shifted / adapted with frequency or something the like ???
Full package in version 1.1 with multi-resolution feature available for download under :
http://www.kinotechnik.edis.at/pages/diyaudio/wavelet/mige0_start_wavelet_ver_1_1.zip
Any help highly welcome !
Michael
Last edited:
Hi,
I think if you change only the GNU Plot version, you'd be able to change the plotting visuality. Octave do not generate the graphs, but exports the data to GNU Plot.
I suspect this is to do with the purpose Lewalle wrote his wavelet as it may not be for analysing impulse response in the first place. That is, if you analyse impulse response you like to generate wavelets with constant amplitude. However, if you like to analyse time-frequency distribution of a 'physics' signal, then you like to normalise the energy of the wavelet transform and your frequency domain amplitude of the wavelet is no longer constant. This is because a long wavelet in time domain has more energy than a short one. Without knowing his purposes, this is what I think. And I have come accross this in my own analyses (other than impulse responses) as well.
The time-frequency resolution is not a bug. It's a property of the selected wavelet") As the frequency get's lower (wavelength getting longer), wavelets start to overlap the reflections. Let's say if you use a wavelet having length of one wavelength, then at 1kHz the wavelets starts to overlap with 1ms reflections.
As the frequency get's lower (wavelength getting longer), wavelets start to overlap the reflections. Let's say if you use a wavelet having length of one wavelength, then at 1kHz the wavelets starts to overlap with 1ms reflections.
Then of course, one can ask a question if it's feasible to analyse signals with time duration shorter than a wavelength at a particular frequency?
Reassignment can help here and increase the virtual temporal resolution, but doesn't remove this property
- Elias
I use :
octave 3_2
qtoctave 0_8_2
GNU-Plot 4_2_6_1
I would not mind about the very different general scaling (easy to fix) – but the tics on the axis are missing too
I think if you change only the GNU Plot version, you'd be able to change the plotting visuality. Octave do not generate the graphs, but exports the data to GNU Plot.
When working towards multi-resolution feature I found a "bug" that is not so obvious when only using the normalized plots of the DIY WTF package (hence I have seen it so late).
A closer inspection of the *un-normalized* plots did show however that the Lewalle code performs different.
Below is what we get from version 1.0 (non - normalized)
And here is what we get form latest version 1.1 (non - normalized) :
I suspect this is to do with the purpose Lewalle wrote his wavelet as it may not be for analysing impulse response in the first place. That is, if you analyse impulse response you like to generate wavelets with constant amplitude. However, if you like to analyse time-frequency distribution of a 'physics' signal, then you like to normalise the energy of the wavelet transform and your frequency domain amplitude of the wavelet is no longer constant. This is because a long wavelet in time domain has more energy than a short one. Without knowing his purposes, this is what I think. And I have come accross this in my own analyses (other than impulse responses) as well.
We see in the plot above, that the non-linear frequency response is now corrected in version 1.1, but there is still an issue in that the time versus frequency resolution isn't constant over the frequency range.
Meaning – for a certain wavelet scaling I get different resolution depending on frequency.
It is easily seen that around 1kHz there is mainly frequency preference resolution where as higher up there is time preference resolution.
The time-frequency resolution is not a bug. It's a property of the selected wavelet
As the frequency get's lower (wavelength getting longer), wavelets start to overlap the reflections. Let's say if you use a wavelet having length of one wavelength, then at 1kHz the wavelets starts to overlap with 1ms reflections.Then of course, one can ask a question if it's feasible to analyse signals with time duration shorter than a wavelength at a particular frequency?
Reassignment can help here and increase the virtual temporal resolution, but doesn't remove this property
- Elias
Last edited:
Hi,
Would give a try with this impulse?
It is crashing teh JMLC option.
CHeers
Mickael
Hi,
What I see your impulse response is very short only 3ms. Maybe generate (measure) a longer one.
- Elias
Hi,
Would give a try with this impulse?
It is crashing teh JMLC option.
CHeers
Mickael
Hi,
What I see your impulse response is very short only 3ms. Maybe generate (measure) a longer one.
- Elias
Mickael, your IR file works fine
Below is what I got with your IR file:

– could you please select "DEBUG MODE" in the first menu and then post a screenshot of the console here, so that we can see at which point you got stuck ?
Also you can try the Lewalle analysis and tell us if those work or crash as well.
Most probably its simply because of what I outlined here:
"As for now the package can process the "Lewalle Morlet wavelet analysis" only, but is fully prepared for the Jean-Michel Le Clea'ch wavelet analysis" as well."
Jean Michel's wavelet analysis is fully prepared for working in my package, but actually not working as for legal reasons.
His code is using a Matlab function that is said to be copyright protected and does not have a free counterpart in Octave.
I strongly doubt that simple math formulas can be copyright protected at all – have you ever heard of FFT to be copyright protected or the most simple formula ever : 1+1=2 !???!
So I *think* it is save to get those gauspuls function and use it – but, not being a lawyer (and not interested in becoming one) – its up to you to check out if that holds for the country you live in or not.
#############
Good thing with your very short IR file is that it reminded me to finish "shape_ir" function for IR files having its peak before 3ms
Here is the corrected file
Code:
function [ir_time_trim, ir_amp_trim] = shape_ir (ir_time, ir_amp, samples_trim, d_bug);

%--------------------------------------------------------
%	 shape_ir
%--------------------------------------------------------
%	This file is part of Diy_Audio_WTF package, intended to get started on Audio Wavelet Transformation
%	on free Octave software
%	Copyright (C) 2010  Michael Gerstgrasser
%
%	"shape_ir" is a functon to shape teh response files for further processing.
%		set IR peak to positive
%		set IR peak to 3ms
%		normalise IR peak to 1
%		set IR length to samples_trim variabel
%
%
%	output variables:
%	"ir_time_shaped" is the vector containing the time data of the IR file
%	"ir_amp_shaped" is the vector containing the amplitude of the IR file
%
%
%	see also :
%	start_wavelet.m, load_arta_txt_ir.m, load_ascii_ir.m, load_ascii1_ir.m,
%	load_wav_ir.m, shape_ir.m, matrix_norm.m, wtf_mag_norm.m, wtf_lecleach.m,
%	wtf_morlet_lewalle.m,  lewa_fftfreq.m, lewa_mymorlet.m, waveletdemo.m, content.m,
%
%	Contributing authors to the Diy_Audio_WTF package in order of code publishing date:
%
%	Michael Gerstgrasser 	- Contact information:  user 'mige0' at www.diyaudio.com
%	Elias Pekonen 		- Contact information:  user 'Elias' at www.diyaudio.com
%	Jacques Lewalle  	- http://www.ecs.syr.edu/faculty/lewalle/
%	Jean-Michel Le Clac'h	- Contact information:  user 'Jmmlc' at www.diyaudio.com
%
%
% 	Diy_Audio_WTF  (Wavelet Audio Analysis) package free software; you can redistribute it and/or modify it
% 	under the terms of the GNU General Public License as published by the
% 	Free Software Foundation; either version 2, or (at your option) any
% 	later version.
%
%
% 	check out on www.diyaudio.com :
%	"Help on making MULTIRESOLUTION WAVELET ANALYSIS available ?"
%	http://www.diyaudio.com/forums/software-tools/163473-help-making-multiresolution-wavelet-analysis-available.html
%	"WTF!? Wavelet TransForm for audio measurements - What-is? and How-to?"
%	http://www.diyaudio.com/forums/multi-way/164029-wtf-wavelet-transform-audio-measurements-what-how.html
%	"Horn Honk $$ WANTED $$"
%	http://www.diyaudio.com/forums/multi-way/161627-horn-honk-wanted.html
%
%
% 	Diy_Audio_WTF is distributed in the hope that it will be useful, but WITHOUT
% 	ANY WARRANTY; without even the implied warranty of MERCHANTABILITY or
% 	FITNESS FOR A PARTICULAR PURPOSE.  See the GNU General Public License
% 	for more details.
%
% 	You should have received a copy of the GNU General Public License
% 	along with Diy_WAA; see the file COPYING.  If not, write to the Free
% 	Software Foundation, 675 Mass Ave, Cambridge, MA 02139, USA.
%
%--------------------------------------------------------

if d_bug == 1;
	disp ("DEBUG report: processing function : load_wav_ir , please WAIT !" )
endif

 	ir_time_trim = ir_time;
 	ir_amp_trim = ir_amp;

%----------- 		set IR peak to positive		--------------------------

amp_max = max (ir_amp_trim);
amp_min = min (ir_amp_trim);

if abs(amp_min) >= abs(amp_max)								% ceck if impulse is positive
	ir_amp_trim = ir_amp_trim .* -1;										% in case not : invert IR
endif


%----------- 		set peak to 3 ms		--------------------------

samples = length (ir_time);										%	total number of samples
time_incr = (ir_time(110)-ir_time(100)) / 10;							% 	check out time interval between samples
s_r_rec = 1 / time_incr;											% 	reconstruckt sample rate
samples_3ms = fix(0.003 / time_incr);								% 	sample count for 3ms


[max_amp, max_amp_pos] = max (ir_amp_trim);					% 	check for position of maxima in matrx
sample_diff = max_amp_pos - samples_3ms;						%	calculate the differnce of peak-ms to 3ms

length(ir_amp_trim)
if sample_diff > 0												% 	in case IR peak is later than 3ms
	ir_amp_trim = ir_amp_trim(abs(sample_diff):end);				% 	cut samples before peak
endif
if sample_diff < 0												% 	in case IR peak is earlier than 3ms
	fill = zeros(abs(sample_diff), 1);
	ir_amp_trim = [fill; ir_amp_trim];								%	add zero value samples before peak
endif

length(ir_amp_trim)

%----------- 		set samples to "samples_trim"		--------------------------

	amp_length=length(ir_amp_trim);

	 if amp_length >= samples_trim							% for sample numbers > samples_trim : truncate
	  	ir_amp_trim = ir_amp_trim (1 : samples_trim);
	 endif

	amp_length=length(ir_amp_trim);

	 if amp_length < samples_trim							% for sample numbers < samples_trim : add  zero value samples
		ir_amp_trim(amp_length:samples_trim) = [0];
	endif

end_time = (samples_trim -1) * time_incr;
ir_time_trim =[0 : time_incr : end_time];						% restore correct frequency vecror


%----------- 		set IR peak to 1		--------------------------

ir_amp_f = 1 / max_amp;
ir_amp_trim = ir_amp_trim * ir_amp_f;
ir_time_trim = ir_time_trim - 0.003;								% assign zero time at IR peak


%-------------------------------------

disp("")
disp ("HELLO !  Samples got trimmed to : ")
samples_trim

if d_bug == 1;
	disp ("DEBUG report: function : load_wav_ir processed successfully" )
endif

endfunctionhttp://www.kinotechnik.edis.at/pages/diyaudio/wavelet/shape_ir.m
And this is how the plots for your FE108 look like now:

We see that the peak is now displayed at 0 time, both in IR plot and in wavelet plot – exactly as it should be...
As you have measured at 96kHz - the severe drop in FR at ~ 50kHz makes the background turning red in normalized plot of course.
Michael
Last edited:
Hi,
I think if you change only the GNU Plot version, you'd be able to change the plotting visuality. Octave do not generate the graphs, but exports the data to GNU Plot.
- Elias
Yeeah sure – I'll check it out..
Hi,
...
I suspect this is to do with the purpose Lewalle wrote his wavelet as it may not be for analysing impulse response in the first place. That is, if you analyse impulse response you like to generate wavelets with constant amplitude. However, if you like to analyse time-frequency distribution of a 'physics' signal, then you like to normalise the energy of the wavelet transform and your frequency domain amplitude of the wavelet is no longer constant. This is because a long wavelet in time domain has more energy than a short one. Without knowing his purposes, this is what I think. And I have come accross this in my own analyses (other than impulse responses) as well.
...
The time-frequency resolution is not a bug. It's a property of the selected wavelet
Then of course, one can ask a question if it's feasible to analyse signals with time duration shorter than a wavelength at a particular frequency?
Reassignment can help here and increase the virtual temporal resolution, but doesn't remove this property
- Elias
Well, you most probably are exactly right - I *think* I already know where to look at – the hurdle (for me blind chicken
) is to get the right variables in Lewalle code straight ...Thanks a lot for making your multi- resolution code available, Elias !
I'm already working on adapting it for the package - some pretty strange plots there too for the moment . ..
Michael
Mickael - just out of curiosity:
did you measure your FE108 outdoors or close mic ?
Ahh - silly me - its simply truncated - hence no reflections beyond ~ 3ms!
I think I have to to account for that with plots as short as the original IR pulse - its simply too misleading otherwise!
Michael
did you measure your FE108 outdoors or close mic ?
Ahh - silly me - its simply truncated - hence no reflections beyond ~ 3ms!
I think I have to to account for that with plots as short as the original IR pulse - its simply too misleading otherwise!
Michael
Last edited:
Jean Michel's wavelet analysis is fully prepared for working in my package, but actually not working as for legal reasons.
His code is using a Matlab function that is said to be copyright protected and does not have a free counterpart in Octave.
Hi,
Matlab has the function gauspuls2 that does not exist in Octave function library. However that does not prevent one using the mathematical gaussian function
Hint hint: I'm also using gaussian function in my multiresolution wavelet script, namely:
wl = e.^(2*pi*j*taajuus(i)*t).*e.^(-t.^2/(2*tb^2));
That should do it!
- Elias
Here is a quick integration of Elias multi-resolution analysis into the DIY WTF package:
Thanks Elias !
Version 1.3 for download:
http://www.kinotechnik.edis.at/pages/diyaudio/wavelet/mige0_start_wavelet_ver_1_3.zip
The plots we get with Mickael's FE108 measurement for example :

As can be seen the plot now does no longer show longer time than was measured – in this case roughly 3ms.
Also I'm working on an option to avoid display of very low frequencies with short IR – does not make any sense either.
It's not completely finished though.
That's all towards some user friendliness and to avoid misleading plots (as good as it gets).
############
Elias, are there variables that can be accessed to adjust for time versus frequency resolution in your code ?
I do that for the Lewalle code and would like to have the same adjustment options with your code...
###########
Thanks, I have a look into that later on – as far as I remember Jean-Michel's code needs an output of *two* variables from gauspuls at some points...
Michael
Thanks Elias !
Version 1.3 for download:
http://www.kinotechnik.edis.at/pages/diyaudio/wavelet/mige0_start_wavelet_ver_1_3.zip
The plots we get with Mickael's FE108 measurement for example :
As can be seen the plot now does no longer show longer time than was measured – in this case roughly 3ms.
Also I'm working on an option to avoid display of very low frequencies with short IR – does not make any sense either.
It's not completely finished though.
That's all towards some user friendliness and to avoid misleading plots (as good as it gets).
############
Elias, are there variables that can be accessed to adjust for time versus frequency resolution in your code ?
I do that for the Lewalle code and would like to have the same adjustment options with your code...
###########
Hi,
Matlab has the function gauspuls2 that does not exist in Octave function library. However that does not prevent one using the mathematical gaussian function
Hint hint: I'm also using gaussian function in my multiresolution wavelet script, namely:
wl = e.^(2*pi*j*taajuus(i)*t).*e.^(-t.^2/(2*tb^2));
That should do it!
- Elias
Thanks, I have a look into that later on – as far as I remember Jean-Michel's code needs an output of *two* variables from gauspuls at some points...
Michael
Last edited:
Hi Michael,
Thanks for spending time for me!
This Impulse response is the tests impulse from MATAA, the measurment package for Octave/Matlab I indicated last week.
It is the only one I have on my Office computer ;-)
I have installed the rev1.3 and still have the issue with the JMLC
Here is the output of the debug mode:
gauspuls2 undefined at line line 86 col 6
called from
wtf_lecleach.m line 86 col 4
start_wavelet.m line 300 col 26
The multi resolution Morlet/lewalle also crash
d_bug undefined at line line 64 col 5
called from
wtf_morlet_lewalle at line 65 col 2
start_wavelet.m line 283 col 26
I didn't try the ir processing tool you have indicated yet.
The plot otherwise are correct now with the origine of time where is should be.
The other options are working fine with the correct results.
BTW the Exit option does not work for me, it keeps Octave busy for ever
Thanks
Mickael
Last edited:
Elias, could you please post the code of the "pcolor.m" version you got the tics on y-axis with or - even better - from which GNU plot version it actually is?
Michael
Hi,
GNU Plot version is 4.3. It came with the Octave 3.0.3 installation package. It's old and I've been using it more than a year and never find any reason to update since no bugs
This is the direct link to the 3.0.3 package
ftp://ftp.gnu.org/pub/gnu/octave/octave-3.0.3.tar.gz
- Elias
Elias, could you please post the code of the "pcolor.m" version you got the tics on y-axis with or - even better - from which GNU plot version it actually is?
Michael
You can also try different grid commands.
For example for my version if I use grid ('on'); I get this:

and if I use grid ('minor'); I get this:

- Elias
Attachments

Last edited:
I have installed the rev1.3 and still have the issue with the JMLC
Here is the output of the debug mode:
gauspuls2 undefined at line line 86 col 6
called from
wtf_lecleach.m line 86 col 4
start_wavelet.m line 300 col 26
OK this tells us that the function "gauspuls2" can't be found – quite as it should be - unless you did a work around.
I'll gonna mark JMLC wavelet analysis as to be experimental until there is a solution for that issue
The multi resolution Morlet/lewalle also crash
d_bug undefined at line line 64 col 5
called from
wtf_morlet_lewalle at line 65 col 2
start_wavelet.m line 283 col 26
BTW the Exit option does not work for me, it keeps Octave busy for ever
That indicates that you might have a version conflict, in that you have set a multitude of valid paths to a multitude of identically named functions.
To avoid this situation either delete all of the old version files -
– or use different folders for each version and delete all valid paths in octave, except the path to the version you want to work with.
This is how I do it and it has the advantage to easily being able to switch between versions (well at least that's good for coding but not necessarily a big advantage for a mere user
)Michael
Hi,
In the multiresolution wavelet transform the time-frequency resolution is optimized somewhere in the 'middle'.
It will automatically adjust depending on start frequency fstart.
If you like to force drive the resolution adjustement, then increase variable tb.
tb = 1/5*1/fstart;
After the previous line if you write:
tb = 2*tb;
you have increased frequency resolution by two folds, and at the same time decreased temporal resolution by two folds.
One can find optimum for each particular case to see what one is looking for.
- Elias
Elias, are there variables that can be accessed to adjust for time versus frequency resolution in your code ?
I do that for the Lewalle code and would like to have the same adjustment options with your code...
Hi,
In the multiresolution wavelet transform the time-frequency resolution is optimized somewhere in the 'middle'.
It will automatically adjust depending on start frequency fstart.
If you like to force drive the resolution adjustement, then increase variable tb.
tb = 1/5*1/fstart;
After the previous line if you write:
tb = 2*tb;
you have increased frequency resolution by two folds, and at the same time decreased temporal resolution by two folds.
One can find optimum for each particular case to see what one is looking for.
- Elias
Thanks Elias – will have a look how to integrate best...
############
Here is version 1.4 for download
http://www.kinotechnik.edis.at/pages/diyaudio/wavelet/mige0_start_wavelet_ver_1_4.zip
An externally hosted image should be here but it was not working when we last tested it.
Main improvement is towards user friendliness.
I now have implemented a looped menu to give user access to :
- wavelet plotting / time after peak
- wavelet plotting / min frequency
- wavelet plotting / minimum magnitude
Also now the current user settings are preserved – meaning you do not have to go through a menu once you found the settings that fit your needs.
Also the file name is preserved from previous run
In case you got lost – there is a menu to recall default settings
And last but not least your impulse files with "*,wav" extension are recognised automatically – so you are not prompted to select wave file type again .
Hope you enjoy
Michael
Well and here is the code :
LOL - did not fit into one posting
Michael
Code:
 %--------------------------------------------------------
%	start_wavelet
%--------------------------------------------------------
%	This file is part of Diy_Audio_WTF package, intended to get started on Audio Wavelet Transformation
%	on free Octave software
%	Copyright (C) 2010  Michael Gerstgrasser
%
%	"start_wavelet" is a script
%	-	to load impulse response files of various formats
%	-	to check valid import by simple impulse response plot
%	-	to examine normalized impulse response plot in zoom mode
%	-	to let you perform wavelet analysis
%
%
%	see also :
%	start_wavelet.m, load_arta_txt_ir.m, load_ascii_ir.m, load_ascii1_ir.m,
%	load_wav_ir.m, shape_ir.m, matrix_norm.m, wtf_mag_norm.m, wtf_lecleach.m,
%	wtf_morlet_lewalle.m,  lewa_fftfreq.m, lewa_mymorlet.m, waveletdemo.m, content.m,
%
%	Contributing authors to the Diy_Audio_WTF package in order of code publishing date:
%
%	Michael Gerstgrasser 	- Contact information:  user 'mige0' at www.diyaudio.com
%	Elias Pekonen 		- Contact information:  user 'Elias' at www.diyaudio.com
%	Jacques Lewalle  	- http://www.ecs.syr.edu/faculty/lewalle/
%	Jean-Michel Le Clac'h	- Contact information:  user 'Jmmlc' at www.diyaudio.com
%
%
% 	Diy_Audio_WTF  (Wavelet Audio Analysis) package free software; you can redistribute it and/or modify it
% 	under the terms of the GNU General Public License as published by the
% 	Free Software Foundation; either version 2, or (at your option) any
% 	later version.
%
%
% 	check out on www.diyaudio.com :
%	"Help on making MULTIRESOLUTION WAVELET ANALYSIS available ?"
%	http://www.diyaudio.com/forums/software-tools/163473-help-making-multiresolution-wavelet-analysis-available.html
%	"WTF!? Wavelet TransForm for audio measurements - What-is? and How-to?"
%	http://www.diyaudio.com/forums/multi-way/164029-wtf-wavelet-transform-audio-measurements-what-how.html
%	"Horn Honk $$ WANTED $$"
%	http://www.diyaudio.com/forums/multi-way/161627-horn-honk-wanted.html
%
%
% 	Diy_Audio_WTF is distributed in the hope that it will be useful, but WITHOUT
% 	ANY WARRANTY; without even the implied warranty of MERCHANTABILITY or
% 	FITNESS FOR A PARTICULAR PURPOSE.  See the GNU General Public License
% 	for more details.
%
% 	You should have received a copy of the GNU General Public License
% 	along with Diy_WAA; see the file COPYING.  If not, write to the Free
% 	Software Foundation, 675 Mass Ave, Cambridge, MA 02139, USA.
%
%--------------------------------------------------------


 clear;
%--------------------------------------------------------
% 	global variable declaration  and assingment
%--------------------------------------------------------

global 	ir_file_name
global	wtf_scale_t
global	wtf_scale_f
global	fmin
global	samples_trim
global	mag_low_limit

%ir_file_name = ("ir_file.wav")						% 	set default for impulse response file name
%wtf_scale_t = 2;									% 	set wavelet number for high time resolution analysis
%wtf_scale_f = 10;									% 	set wavelet number for high frequency resolution analysis
%fmin = 500;										%	set min frequency in wavelet plotting
%samples_trim = 1024;								%	set samples to process (must be power 2 !)
%mag_low_limit =- 40;								%	set minimum dB magnitude in waveelt plotting
%save  ("sett_def.mat", "ir_file_name", "wtf_scale_t", "wtf_scale_f", "fmin", "samples_trim", "mag_low_limit","fstart", "fstop", "plot_time_length" );


%--------------------------------------------------------
% 	local variable assignment
%--------------------------------------------------------

fstart = 500;										%	set start frequency for wavelet processing
fstop = 20000;									%	set stop frequency for wavelet processing
plot_time_length = 10;								% 	set plotting time after peak [ms]


%--------------------------------------------------------
%	load user settings in case they got lost
%--------------------------------------------------------

if isempty (ir_file_name);								% 	restore user setting for impulse response file name
	load ("sett_user.mat", "ir_file_name")
endif
if isempty (wtf_scale_t);								% 	restore user setting wavelet number for high time resolution analysis
	load ("sett_user.mat", "wtf_scale_t" )
endif
if isempty (wtf_scale_f);								% 	restore user setting wavelet number for high frequency resolution analysis
	load ("sett_user.mat", "wtf_scale_f" )
endif
if isempty (fmin);;										%	restore user setting min frequency in wavelet plotting
	load ("sett_user.mat", "fmin")
endif
if isempty (samples_trim);								%	restore user setting samples to process (must be power 2 !)
	load ("sett_user.mat", "samples_trim")
endif
if isempty (mag_low_limit);								%	restore user setting minimum dB magnitude in waveelt plotting
	load ("sett_user.mat", "mag_low_limit" )
endif
if isempty (fstart);								%	restore user settings start frequency for wavelet processing
	load ("sett_user.mat", "fstart" )
endif
if isempty (fstop);								%	restore user setting stop frequency for wavelet processing
	load ("sett_user.mat", "fstop" )
endif
if isempty (plot_time_length);					%	restore user setting plotting time after peak [ms]
	load ("sett_user.mat", "plot_time_length" )
endif


%--------------------------------------------------------
% 	introduction -
%--------------------------------------------------------

disp("")
disp("")
disp("#######+++++++++++++++++++++++++++++++++++++++++##########")
disp("")
disp("")
disp("HELLO !     Wecome to DIY Audio Wavelet Analysis ! ")
disp("contributing authors : ")
disp("Michael Gerstgrasser ")
disp("Elias Pekonen ")
disp("Jaques Lewalle ")
disp("Jean-Michel Le Cleac'h ")
disp("")
disp("You will be promted to pick your choices... ")
disp("")


%--------------------------------------------------------
% 	  - prompt for debug option and user settings
%--------------------------------------------------------

disp("")
disp("")
disp("")
k=0;
d_bug=1;
k=menu("HELLO !  Enter 1 for normal operation", " normal operation", " change current user setings"," debug mode", " EXIT");

if k==1;
	d_bug = 0;
endif;
if k==2;
	skip_menu =  0;
	while skip_menu != 1; 											% establish a menu loop
		%--------------------------------------------------------
		% 	 - display / hide current user settings -
		%--------------------------------------------------------

		disp("")
		disp("")
		disp("")
		disp("")
		disp("HELLO !  Current user settings : ")
		disp("")
		%	disp(["Impulse response  file :  ", ir_file_name]);
		disp(["wavelet plotting / time after peak :  ", num2str(plot_time_length ), " [ms] "])
		disp(["wavelet plotting / min frequency :  ", num2str(fmin), " [Hz] "])
		disp(["wavelet plotting / minimum magnitude :  ", num2str(mag_low_limit), " [dB] "])
		%disp(["samples to process (must be power 2 !) :  ", num2str(samples_trim)]);
	 	disp(["wavelet number for high time resolution analysis (Lewalle analysis only) :  ",num2str(wtf_scale_t)])
		disp(["wavelet number for high frequency resolution analysis (Lewalle analysis only) :  ", num2str(wtf_scale_f)])
		%	disp(["start frequency for wavelet processing :                      ", fstart])
		%	disp(["start frequency for wavelet processing :                      ", fstop])

		disp("")
		disp("")
		d_bug=0;
		kk=0;
		kk=menu("HELLO !  Change current user settings (seen above), or enter 1 to proceed ", " proceed without changing current settings"," change: time after peak [ms] to be displayed"," change: min frequency  [Hz] to be displayed", " change: minimum magnitude [dB ] to be displayed ", " load default settings", " EXIT");
		if kk == 1
			disp("")
			disp("no further changes made")
			skip_menu = 1;
			disp("")
			disp("")
			disp("HELLO !  Current user settings : ")
			disp("")
			%	disp(["Impulse response  file :  ", ir_file_name]);
			disp(["wavelet plotting / time after peak :  ", num2str(plot_time_length ), " [ms] "])
			disp(["wavelet plotting / min frequency :  ", num2str(fmin), " [Hz] "])
			disp(["wavelet plotting / minimum magnitude :  ", num2str(mag_low_limit), " [dB] "])
			%disp(["samples to process (must be power 2 !) :  ", num2str(samples_trim)]);
		 	disp(["wavelet number for high time resolution analysis (Lewalle analysis only) :  ",num2str(wtf_scale_t)])
			disp(["wavelet number for high frequency resolution analysis (Lewalle analysis only) :  ", num2str(wtf_scale_f)])
			%	disp(["start frequency for wavelet processing :                      ", fstart])
			%	disp(["start frequency for wavelet processing :                      ", fstop])

			disp("")
			disp("")
		endif
		if kk == 2
			disp("")
			disp("current setting : ")
			disp(["wavelet plotting / time after peak  :  ", num2str(plot_time_length ), " [ms]"])
			disp("")

			fflush (stdout);
			plot_time_length_prompt = input(["HELLO !  Please type in new value ( press ENTER for :  ",num2str(plot_time_length), "  )"]);
			if isempty(plot_time_length_prompt);
				plot_time_length=plot_time_length;							% assign default
				else
					plot_time_length = plot_time_length_prompt;					% or assign prompt
			endif;
		endif
		if kk == 3
			disp("")
			disp("current setting : ")
			disp(["wavelet plotting / min frequency :  ", num2str(fmin), " [Hz]"])
			disp("")
			disp("WARNING !  Be aware that increasing display range towards lower frequencies can result in huge calculation time ")
			fflush (stdout);
			fmin_prompt = input(["HELLO !  Please type in new value ( press ENTER for :  ",num2str(fmin), "  )"]);
			if isempty(fmin_prompt);
				fmin=fmin;							% assign default
				else
					fmin = fmin_prompt;					% or assign prompt
			endif;
		endif
		if kk ==4
			disp("")
			disp("current setting : ")
			disp(["wavelet plotting / minimum magnitude :  ", num2str(mag_low_limit), " [dB] "])
			disp("")

			fflush (stdout);
			mag_low_limit_prompt = input(["HELLO !  Please type in new value ( press ENTER for :  ",num2str(mag_low_limit), "  )"]);
			if isempty(mag_low_limit_prompt);
				mag_low_limit=mag_low_limit;							% assign default
				else
				mag_low_limit = mag_low_limit_prompt;					% or assign prompt
			endif;
		endif
		if kk == 5
			load  ("sett_def.mat", "ir_file_name", "wtf_scale_t", "wtf_scale_f", "fmin", "samples_trim", "mag_low_limit","fstart", "fstop" , "plot_time_length");
			disp("")
			disp(" default setting loaded")
		endif
		if kk==6;
			disp("")
			disp("DIY wavlet analysis will be terminated")
			quit;
		endif;
	endwhile ; 													% close a  menu loop
endif;
if k==3;
	d_bug=1;
	disp("")
	disp("DEBUG mode selected !  Additional progress information will be displayed")
endif;
if k==4;
	disp("")
	disp("DIY wavlet analysis will be terminated")
	quit;
endif;


%--------------------------------------------------------
% 	prompt for file name
%--------------------------------------------------------

disp("")
disp("Make sure your impulse response file is located where it can be found by Octave")
disp("Make sure your impulse response file name avoids spaces and special characters")
disp("")

fflush (stdout);
ir_file_prompt=input(["HELLO !  Please type in file name ( press ENTER for :  ",(ir_file_name), " )"],"s");

if isempty(ir_file_prompt);
	ir_file_name=ir_file_name;							% assign default
	else
		ir_file_name = ir_file_prompt;					% or assign prompt
endif;

ir_file_name											% display selected file name
disp("")
disp("")


%--------------------------------------------------------
% 	prompt for file type (ir extension is NOT ".wav")
%--------------------------------------------------------


point_pos = rindex (ir_file_name, ".");				% string extension detect
str_xt = ir_file_name(point_pos+1:end);			% string extension extract
if length(str_xt) != 3							% check if extension is exactly charactacters
	str_xt = "000";
endif

if (str_xt) == "wav"							% check if extension is "wav"
%	if k==1,
		disp("please wait... ")
%		disp(ir_file_name)						% display selected file name
		disp("16 bit or 32 bit WAV file will be imported")
		disp("")
		disp("Make sure to use a 16 bit or 32 bit WAV impulse respones file")
		[ir_time ir_amp] = load_wav_ir(d_bug);		% load wav32 impulse response file and assign to variables ir_time, ir_amp
%	endif

	else 									%	 if extension is NOT ".wav" then prompt user
	k=0;
	k=menu("HELLO !  Please select your impulse response file type","32 bit or 16 bit WAV file","ARTA txt file","two column TEXT file","one column TEXT file","CLIO mls file ( experimental )","EXIT");

	if k==1,
		disp("please wait... ")
		disp(ir_file_name)						% display selected file name
		disp("16 bit or 32 bit WAV file will be imported")
		disp("")
		disp("Make sure to use a 16 bit or 32 bit WAV impulse respones file")
		[ir_time ir_amp] = load_wav_ir(d_bug);		% load wav32 impulse response file and assign to variables ir_time, ir_amp
	endif

	if k==2,
		disp("")
		disp("please wait... ")
		disp(ir_file_name)
		disp("ARTA text file  will be imported")
		disp("")
		disp("Depending on IR-length - this may take a few minutes")
		disp("Make sure to use a TEXT impulse respones file exported from ARTA")
		disp("")
		[ir_time ir_amp] = load_arta_txt_ir(d_bug);	% load ARTA txt impulse response file and assign to variables ir_time, ir_amp
	endif
	if k==3,
		disp("")
		disp("please wait... ")
		disp(ir_file_name)						% display selected file name
		disp("Two column TEXT file will be imported")
		disp("")
		disp("Make sure to use a plain TEXT, headerless, two column impulse response file")
		disp("Make sure first column in your impulse response file contains time")
		disp("Make sure second column in your impulse response file contains amplitude")
		[ir_time ir_amp] = load_ascii_ir(d_bug);			% load ascii impulse response file and assign to variables ir_time, ir_amp
	endif
	if k==4,
		disp("")
		disp("please wait... ")
		disp(ir_file_name)						% display selected file name
		disp("One column TEXT file will be imported")
		disp("")
		disp("Make sure to use a plain TEXT, headerless, one column impulse response file")
		disp("Make sure first column in your impulse response file contains amplitude")
		disp("Check the following plot for correct impulse response file import")
		[ir_time ir_amp] = load_ascii1_ir(d_bug);			% load ascii impulse response file and assign to variables ir_time, ir_amp
	endif
	if k==5,
		disp("")
		disp("please wait... ")
		disp(ir_file_name)								% display selected file name
		disp("One column TEXT file will be imported")
		disp("")
		disp("Make sure to use a plain TEXT, headerless, one column impulse response file")
		disp("Make sure first column in your impulse response file contains amplitude")
		disp("Check the following plot for correct impulse response file import")
		[ir_time ir_amp] = load_clio_ir(d_bug);			% load ascii impulse response file and assign to variables ir_time, ir_amp
	endif
	if k==6,
		disp("")
		disp("DIY wavlet analysis will be terminated")
		quit;
	endif;
endif

%--------------------------------------------------------
%	restore  and display : samplerate , sample count , total time
%--------------------------------------------------------

disp("")
disp("")
disp("HELLO ! Properties of imported file :")
disp("")

sample_rate = 10/(ir_time(110)-ir_time(100))			% reconstruckt and display sample rate
samples = length(ir_amp)							% display sample count
total_time = samples / sample_rate					% calculate and display total time of measurement
valid_high_freq = sample_rate / 2;					% calculate highest valid frequency for processing


%--------------------------------------------------------
%	plot impulse response to check correct import
%--------------------------------------------------------


disp("")
disp("")
disp("HELLO !  Please check the following plot for correct impulse respones file import [Figure 1]")

figure(1)
clf(1);
plot (ir_time,ir_amp,"-;Impulse Response;")
set (gca (), "xlim", [0 0.1]);
title(["HELLO !   Please check plot below for correct impulse response import (first 100ms) ! "," Imported file: ",(ir_file_name)])
xlabel ("Time in seconds");
ylabel ("Amplitude");


%--------------------------------------------------------
%	perform IR shaping and prepare for wavelet processing
%--------------------------------------------------------


[ir_time_trim, ir_amp_trim, peak_del_time, valid_low_freq] = shape_ir (ir_time, ir_amp, samples_trim, d_bug);

if valid_low_freq < fmin
	fstart = fmin;							%	set fstart (in Pekonen analysis) to low frequency limit for plotting, if IR length allows
	else
		fstart = valid_low_freq;				% 	otherwise  limit low frequency processing according to IR length
endif
fstop = sample_rate/2;						%	set fstop to sample rate / 2


%--------------------------------------------------------
%	prompt for wavelet analysis type
%--------------------------------------------------------

analysis_type = "xxxx";

disp("")
disp("")
k=0;
k=menu("HELLO ! please select wavlet analysis"," Multi-Resolution Wavelet Analysis (Elias Pekonen)", " Multi-Resolution Wavelet Analysis (Morlet / Jaques Lewalle / experimental )"," Jaques Lewalle Morlet Wavelet Analysis ( experimental )"," Jean-Michel Le Cleac'h Wavelet Analysis ( experimental )", " EXIT");

if k==1;
	analysis_type = "peko";
	disp("")
	disp("HELLO !  Wavelet analysis in progress - this may take a few minutes")
	wtf_scale_f = wtf_scale_t;							% 	set equalfor plotting option
	[wtf_t, wtf_f, wtf_mag] = wtf_pekonen (ir_time_trim, ir_amp_trim, wtf_scale_t, fstart, fstop, mag_low_limit, d_bug);
	wtf_t = wtf_t + (peak_del_time * 1000);				% 	correction mirroring
endif;
if k==2;
	analysis_type = "lewa";
	disp("")
	disp("HELLO !  Wavelet analysis in progress - this may take a few minutes")
	disp("Be aware that this analysis is experimental ! ")
	disp("Analysis is not of constant resolution over frequency yet ! ")
	wtf_scale_t = 2;									% 	set wavelet number for high time resolution analysis
	wtf_scale_f = 10;									% 	set wavelet number for high frequency resolution analysis
	[wtf_t, wtf_f, wtf_mag] = wtf_morlet_lewalle (ir_time_trim, ir_amp_trim, wtf_scale_t, fstart, fstop, d_bug);
	disp("HELLO !  Multi resolution wavelet analysis in progress - this may take another few minutes")
	[wtf_f, wtf_f, wtf_mag_f] = wtf_morlet_lewalle (ir_time_trim, ir_amp_trim, wtf_scale_f, fstart, fstop, d_bug);
endif;
if k==3;
	analysis_type = "lewa";
	disp("")
	disp("HELLO !  Wavelet analysis in progress - this may take a few minutes")
	disp("Be aware that this analysis is experimental ! ")
	disp("Analysis is not of constant resolution over frequency yet ! ")
	wtf_scale_f = wtf_scale_t;							% 	set equalfor plotting option
	[wtf_t, wtf_f, wtf_mag] = wtf_morlet_lewalle (ir_time_trim, ir_amp_trim, wtf_scale_t, fstart, fstop, d_bug);
endif;
if k==4;
	disp("")
	disp("HELLO !  Wavelet analysis in progress - this may take a few minutes")
	disp("Be aware that this analysis is experimental ! ")
	disp("There is a  work around needed for function gauspuls2  !")
	wtf_scale_f = wtf_scale_t;							% 	set equalfor plotting option
	[wtf_t, wtf_f, wtf_mag] = wtf_lecleach (ir_time_trim, ir_amp_trim, fstart, fstop, d_bug) ;
endif;
if k==5;
	disp("")
	disp("DIY wavelet analysis will be terminated")
	quit;
endif;


%--------------------------------------------------------
%	plot normalised impulse response
%--------------------------------------------------------

disp("")
disp ("HELLO !  Normalised impulse response will be displayed [Figure 2]")

figure(2)
clf(2);
plot (ir_time_trim,ir_amp_trim,"-;Impulse Response;")
title(["HELLO !   Please check plot below for correct impulse response import (first 10ms) ! "," Imported file: ",(ir_file_name)])
set (gca (), "xlim", [-0.003  plot_time_length]);
xlabel ("Time in seconds");
ylabel ("Amplitude");


%--------------------------------------------------------
%	plot normalised impulse response
%--------------------------------------------------------

disp("")
disp ("HELLO !  Normalised impulse response will be displayed [Figure 2]")

figure(2)
clf(2);
plot (ir_time_trim,ir_amp_trim,"-;Impulse Response;")
title(["HELLO !   Please check plot below for correct impulse response import (first 10ms) ! "," Imported file: ",(ir_file_name)])
set (gca (), "xlim", [-0.003  (plot_time_length/1000)]);
xlabel ("Time in seconds");
ylabel ("Amplitude");


%--------------------------------------------------------
%	prepare for wavelt plotting
%--------------------------------------------------------

if analysis_type == "lewa";
	wtf_t = wtf_t - (peak_del_time * 1000);					% 	shift max peak in Lewalle wavelet plot analysis to zero time
endif
if analysis_type == "peko";
	wtf_t = wtf_t - (peak_del_time * 1000);					% 	shift max peak in Pekonnen wavelet plot analysis to zero time
endif
fmax = max (wtf_f);									%	check for max freqeuncy to plot
if fmin < valid_low_freq
	fmin = valid_low_freq;								%	limit plot to valid low frequency, according to IF length
endif

%--------------------------------------------------------
%	plot  wavlet analysis
%--------------------------------------------------------

matrixx_t = wtf_mag;
max_wtf_mag = max(max(matrixx_t));					%	check for max value
matrixx_t = matrixx_t - max_wtf_mag;	 					% 	set 0dB as max value
matrixx_t = max(mag_low_limit,matrixx_t);				% 	set minimum magnitude to mag_low_limit


if wtf_scale_t == wtf_scale_f							% distingush between mulltiresolution versus simple nalysis
	disp("")
	disp ("HELLO !  Wavelet plot will be displayed  (time resolution preferenced) [Figure 3] ")

	figure (3);
	clf(3);
	pcolor (wtf_t, wtf_f, matrixx_t);
	shading ("interp");
	 colorbar ();
	xlabel ("Time [ms]");
	ylabel ("Freq [Hz]");
	set (gca (), "yscale", "log");
	set (gca (), "xlim", [-3 plot_time_length]);
	set (gca (), "ylim", [fmin fmax]);
	title(["WTF spectrogram  (time resolution preferenced)  ",(ir_file_name)])
	grid("minor");
	else
		disp("")
		disp ("HELLO !  Wavelet plot (time resolution preferenced) will be displayed [Figure 3] ")

		figure (3);
		clf(3);
		pcolor (wtf_t, wtf_f, matrixx_t);
		shading ("interp");
		colorbar ();
		xlabel ("Time [ms]");
		ylabel ("Freq [Hz]");
		set (gca (), "yscale", "log");
		set (gca (), "xlim", [-3 plot_time_length]);
		set (gca (), "ylim", [fmin fmax]);
		title(["WTF spectrogram (time resolution preferenced)  ",(ir_file_name)])
		grid("minor");

		matrixx_f = wtf_mag_f;
		max_wtf_mag = max(max(matrixx_f));					%	check for max value
		matrixx_f = matrixx_f - max_wtf_mag;	 					% 	set 0dB as max value
		matrixx_f = max(mag_low_limit,matrixx_f);				% 	set minimum magnitude to mag_low_

		disp("")
		disp ("HELLO !  Wavelet plot (frequency resolution preferenced) will be displayed [Figure 4] ")

		figure (4);
		clf(4);
		pcolor (wtf_t, wtf_f, matrixx_f);
		shading ("interp");
		colorbar ();
		xlabel ("Time [ms]");
		ylabel ("Freq [Hz]");
		set (gca (), "yscale", "log");
		set (gca (), "xlim", [-3 plot_time_length]);
		set (gca (), "ylim", [fmin fmax]);
		title(["WTF spectrogram  (frequency resolution preferenced)  ",(ir_file_name)])
		grid("minor");
endif


%--------------------------------------------------------
%	plot normalised wavlet analysis
%--------------------------------------------------------

	matrixx_norm_t = matrix_norm( wtf_mag, d_bug);					%	normalize matrix to peak value
	max_wtf_mag_t = max(max(matrixx_norm_t));						%	check for max value
	matrixx_norm_t = matrixx_norm_t - max_wtf_mag_t;	 				% 	set 0dB as max value
	matrixx_norm_t = max(mag_low_limit,matrixx_norm_t);				% 	set minimum magnitude to mag_low_limit


if wtf_scale_t == wtf_scale_f							% distingush between mulltiresolution versus simple nalysis
	disp("")
	disp ("HELLO !  Normalised wavelet plot will be displayed  (frequency resolution preferenced) [Figure 5] ")

	figure (5);
	clf(5);
	pcolor (wtf_t, wtf_f, matrixx_norm_t);
	shading ("interp");
	colorbar ();
	xlabel ("Time [ms]");
	ylabel ("Freq [Hz]");
	set (gca (), "yscale", "log");
	set (gca (), "xlim", [-3 plot_time_length]);
	set (gca (), "ylim", [fmin fmax]);
	title(["WTF normalised spectrogram (time resolution preferenced)  ",(ir_file_name)])
	grid("minor");
	else
		matrixx_norm_f = matrix_norm( wtf_mag_f, d_bug);					%	normalize matrix to peak value
		max_wtf_mag_f = max(max(matrixx_norm_f));						%	check for max value
		matrixx_norm_f = matrixx_norm_f - max_wtf_mag_f;	 				% 	set 0dB as max value
		matrixx_norm_f = max(mag_low_limit,matrixx_norm_f);				% 	set minimum magnitude to mag_low_limit

		disp("")
		disp ("HELLO !  Normalised  wavelet plot (time resolution preferenced) will be displayed [Figure 5] ")

		figure (5);
		clf(5);
		pcolor (wtf_t, wtf_f, matrixx_norm_t);
		shading ("interp");
		colorbar ();
		xlabel ("Time [ms]");
		ylabel ("Freq [Hz]");
		set (gca (), "yscale", "log");
		set (gca (), "xlim", [-3 plot_time_length]);
		set (gca (), "ylim", [fmin fmax]);
		title(["WTF normalised spectrogram (time resolution preferenced)   ",(ir_file_name)])
		grid("minor");

		disp("")
		disp ("HELLO !  Normalised wavelet plot (frequency resolution preferenced) will be displayed [Figure 6] ")

		figure (6);
		clf(6);
		pcolor (wtf_t, wtf_f, matrixx_norm_f);
		shading ("interp");
		colorbar ();
		xlabel ("Time [ms]");
		ylabel ("Freq [Hz]");
		set (gca (), "yscale", "log");
		set (gca (), "xlim", [-3 plot_time_length]);
		set (gca (), "ylim", [fmin fmax]);
		title(["WTF normalized spectrogram (frequency resolution preferenced)  ",(ir_file_name)])
		grid("minor");
endif


%--------------------------------------------------------
%	plot multiresolution wavlet analysis
%--------------------------------------------------------


if wtf_scale_t != wtf_scale_f								% distingush between mulltiresolution versus simple nalysis


	matrixx_mr = (matrixx_t .+ matrixx_f)/2; 						%	overlay time preferenced with frequency preferenced analysis
	max_wtf_mag_mr = max(max(matrixx_mr));					%	check for max value
	matrixx_mr = matrixx_mr - max_wtf_mag_mr;	 				% 	set 0dB as max value
	matrixx_mr = max(mag_low_limit,matrixx_mr);					% 	set minimum magnitude to mag_low_limit

	disp("")
	disp ("HELLO !  Multi resolution wavelet plot  will be displayed [Figure 7] ")

	figure (7);
	clf(7);
	pcolor (wtf_t, wtf_f, matrixx_mr);
	shading ("interp");
	colorbar ();
	xlabel ("Time [ms]");
	ylabel ("Freq [Hz]");
	set (gca (), "yscale", "log");
	set (gca (), "xlim", [-3 plot_time_length]);
	set (gca (), "ylim", [fmin fmax]);
	title(["WTF multi-resolution spectrogram",(ir_file_name)])
	grid("minor");

	matrixx_norm_mr = ((matrixx_norm_t) .+ matrixx_norm_f)/2;
	max_wtf_mag_mr = max(max(matrixx_norm_mr));						%	check for max value
	matrixx_norm_mr = matrixx_norm_mr - max_wtf_mag_mr;	 			% 	normalize
	matrixx_norm_mr = max(mag_low_limit,matrixx_norm_mr);				% 	set minimum magnitude to mag_low_limit


	disp("")
	disp ("HELLO !  Multi resolution wavelet plot (normalised) will be displayed [Figure 8] ")

	figure (8);
	clf(8);
	pcolor (wtf_t, wtf_f, matrixx_norm_mr);
	shading ("interp");
	colorbar ();
	xlabel ("Time [ms]");
	ylabel ("Freq [Hz]");
	set (gca (), "yscale", "log");
	set (gca (), "xlim", [-3 plot_time_length]);
	set (gca (), "ylim", [fmin fmax]);
	title(["WTF multi-resolution spectrogram (normalised)",(ir_file_name)])
	grid("minor");
endif


%--------------------------------------------------------
%	save user settings
%--------------------------------------------------------


save  ("sett_user.mat", "ir_file_name", "wtf_scale_t", "wtf_scale_f", "fmin", "samples_trim", "mag_low_limit","fstart", "fstop", "plot_time_length" );
LOL - did not fit into one posting
Michael
I have gauspuls in Octave. Had to install a bunch of random Octave related packages in Ubuntu but it's there now. I guess is was in one of the signal processing related packages. I did abandon getting the Jmmlc script to work though.
Here is the code if it helps.
I am running Octave under Ubuntu in a virtual machine.
BTW how long does it take to generate a typical plot?
And running longer time window and low frequency seems to eat up a huge amount of memory.
Have to test the latest version later.
As the code is released under GNU I could post some other wavelets if you want.
Here is the code if it helps.
Code:
## Copyright (C) 2007   Sylvain Pelissier   <sylvain.pelissier@gmail.com>
##
## This program is free software; you can redistribute it and/or modify
## it under the terms of the GNU General Public License as published by
## the Free Software Foundation; either version 2 of the License, or
## (at your option) any later version.
##
## This program is distributed in the hope that it will be useful,
## but WITHOUT ANY WARRANTY; without even the implied warranty of
## MERCHANTABILITY or FITNESS FOR A PARTICULAR PURPOSE.  See the
## GNU General Public License for more details.
##
## You should have received a copy of the GNU General Public License
## along with this program; If not, see <http://www.gnu.org/licenses/>.

## -*- texinfo -*-
## @deftypefn {Function File} {[@var{y}] =} gauspuls(@var{t},@var{fc},@var{bw})
##	Return the Gaussian modulated sinusoidal pulse.
## @end deftypefn

function [y] = gauspuls(t,fc,bw)
	if nargin<1, error("Usage : gauspuls(t,fc,bw)"); end
	if nargin<2,
		fc = 1e3;
		bw = 0.5;
	end
	if nargin < 3, bw = 0.5; end
	if fc < 0 , error("fc must be positive"); end
	if bw <= 0, error("bw must be stricltly positive"); end

	fv = -(bw.^2.*fc.^2)/(8.*log(10.^(-6/20)));
	tv = 1/(4.*pi.^2.*fv);
	y = exp(-t.*t/(2.*tv)).*cos(2.*pi.*fc.*t);
endfunction
I am running Octave under Ubuntu in a virtual machine.
BTW how long does it take to generate a typical plot?
And running longer time window and low frequency seems to eat up a huge amount of memory.
Have to test the latest version later.
As the code is released under GNU I could post some other wavelets if you want.
- Status
- This old topic is closed. If you want to reopen this topic, contact a moderator using the "Report Post" button.
- Home
- Design & Build
- Software Tools
- Help on making MULTIRESOLUTION WAVELET ANALYSIS available ?