The dutch speaker: Studio de Schop ML 1.1 was designed using the Golden Ratio and didn't use any damping. Sounded quite nice too.
http://forum.zelfbouwaudio.nl/viewtopic.php?f=4&t=11178
http://forum.zelfbouwaudio.nl/viewtopic.php?f=4&t=11178
Of course. But a dimension ratio of 2 to 1 is clearly the worst possible choice if well spaced harmonics are desired.
You do understand that, right?
Hello Dave,
As you can see 1:1:2 gives very bad result (max interval between 2 following resonances >80Hz/m). But 1 : 1.5 : 2 gives not so bad result (around 30Hz/m).
For sure, while giving a good spread of the resonances frequencies, a n integer value for a ratio may produce some coincident resonances (but this doesn't affect so much the spread it has more influence on the intensity of the resonance).
I don't care in that graph if resonances overimpose one to the other. But for sure evryone should choose a ratio which is not an integer value but taken from the red line passing through the points :
1 : 1.3 : 1.5
1 : 1.5 : 2.0
1 : 1.9 : 2.5
1 : 2.3 : 3.0
1 : 2.5 : 3.5
1 : 3.0 : 4.0
So if you want replace my sentence :
"Good shapes that spread optimally the resonances frequencies seem to be :
1 : 1.3 : 1.5 ; 1 : 1.5 : 2.0, etc."
by :
"Good shapes that spread optimally the resonances frequencies are located on the red line passing through the points : 1 : 1.3 : 1.5 ; 1 : 1.5 : 2.0, etc. but you should avoid integer values of the ratios"
Best regards from Paris, France
Jean-Michel Le Cléac'h
thanks Dave,re: Fibinacci...David S.

Hello Dave,
As you can see 1:1:2 gives very bad result (max interval between 2 following resonances >80Hz/m). But 1 : 1.5 : 2 gives not so bad result (around 30Hz/m).
For sure, while giving a good spread of the resonances frequencies, a n integer value for a ratio may produce some coincident resonances (but this doesn't affect so much the spread it has more influence on the intensity of the resonance).
I don't care in that graph if resonances overimpose one to the other. But for sure evryone should choose a ratio which is not an integer value but taken from the red line passing through the points :
Best regards from Paris, France
Jean-Michel Le Cléac'h
Just not following your logic here at all.
You seem to be looking at the spread in Hz between one set of modes and the next. Since moving the modes away from those of one dimension eventually gets you closer to the next higher mode, there are optimums as shown by your traced red line. Still, every discussion I have seen on the subject tries to get modes to fall away from the modes of each other axis.
The goal is clearly not to have any superimposing. (Which is why cubic rooms and integer multiple dimensions are always warned against.)
Your analysis looks at modes of dimension A vs those of dimension B. It then looks at B vs. C. Optimization of those ignores the A vs. C factor. It is a 2D solution to a 3D problem.
The lower modes will be most evenly spaced with the cube root of 2 approach. (1: 1.260 : 1.587)
The table below shows this. It uses those ratios and is normalized to a dimension with 100 Hz for the first mode of the shortest dimension. The first 10 modes are shown.
1 1.26 1.587
100 79 63
200 159 126
300 238 189
400 317 252
500 397 315
600 476 378
700 556 441
800 635 504
900 714 567
1000 794 630
Where even this approach breaks down is that the higher modes start to overlap. For example the 4th harmonic of the "1" dimension is about the same as the 5th harmonic of the "1.26" dimension. (400 vs. 397)
Still this advice is given for room design because the goals are even spacing at the low end and eventualy enough modes per Octave are achieved (modal density is a desirable thing).
In the box case that we are talking about, if it mattered, we could be assured that upper range modes are dealt with via even minor damping and equal spacing of the low modes (as assured here) would be the best result.
David S.
if you build like most, by sinking the baffle, then that baffle is already very very close to your internal ratio anyway. If you build to optimise baffle instead, you can make up the internal ratio to equal the baffle ratio, using damping... It would depend on the size of the box in question but there isnt much of a discrepancy to begin with.
The dutch speaker: Studio de Schop ML 1.1 was designed using the Golden Ratio and didn't use any damping. Sounded quite nice too.
forum.zelfbouwaudio.nl • Toon onderwerp - Speakers vervangen uit "Studio de Schop ML1.3"
If the speaker pictured is the one you are talking about, it is not Golden Ratio.
An externally hosted image should be here but it was not working when we last tested it.
dave
If damping the box removes resonance concerns ... why shouldn't the ratio(s) being discussed lend themselves to minimizing baffle diffraction? Isn't this a bigger deal?
I would agree that is a much bigger deal.
Diffraction can generally ignore depth (2nd order diffraction is very low). Front panel dimensions can be important, although you can have ill chosen dimensions and place the drivers off center and be okay. Certainly the diffraction effect is measureable and audible. I haven't seen anything but conjecture regarding the bunching of internal dimension modes.
David S
Dave,
My study simply solves the 3D Rayleigh equation
http://www.bobgolds.com/Tangental/EverestRayleighModeEquation.GIF
using p, q and r values from 0 to a large number (10 from memory) using all the combinations between p,q and r.
Then the frequencies are just sorted out. Then it is easy to have a statistical view of the spreading...
This method as yet been discussed since at least 10 years and your are the only one complaining about it.
What you are referring it doesn't concern spreading it concern overimposed frequencies (for different p,q, r values depending on the shape you may obtain a same resonance frequency).
I don't say that all the points on the red line are perfect but it the red line allows to save time in order to choose the sahpe (or to modify a given shape adding internal walls...)
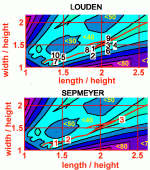
The same garphical approach seems to have been both used (but with probably less data that mine) by Louden and by Japanese. See graph attached.
IMHO you exagerate the importance of surimposed resonances ... ( if you have such you have to break some modes by the proper acoustic treatment of your room...)
Best regards from Paris, France.
Jean-Michel Le Cléac'h
My study simply solves the 3D Rayleigh equation
http://www.bobgolds.com/Tangental/EverestRayleighModeEquation.GIF
using p, q and r values from 0 to a large number (10 from memory) using all the combinations between p,q and r.
Then the frequencies are just sorted out. Then it is easy to have a statistical view of the spreading...
This method as yet been discussed since at least 10 years and your are the only one complaining about it.
What you are referring it doesn't concern spreading it concern overimposed frequencies (for different p,q, r values depending on the shape you may obtain a same resonance frequency).
I don't say that all the points on the red line are perfect but it the red line allows to save time in order to choose the sahpe (or to modify a given shape adding internal walls...)
The same garphical approach seems to have been both used (but with probably less data that mine) by Louden and by Japanese. See graph attached.
IMHO you exagerate the importance of surimposed resonances ... ( if you have such you have to break some modes by the proper acoustic treatment of your room...)
Best regards from Paris, France.
Jean-Michel Le Cléac'h
Just not following your logic here at all.
You seem to be looking at the spread in Hz between one set of modes and the next. Since moving the modes away from those of one dimension eventually gets you closer to the next higher mode, there are optimums as shown by your traced red line. Still, every discussion I have seen on the subject tries to get modes to fall away from the modes of each other axis.
The goal is clearly not to have any superimposing. (Which is why cubic rooms and integer multiple dimensions are always warned against.)
Your analysis looks at modes of dimension A vs those of dimension B. It then looks at B vs. C. Optimization of those ignores the A vs. C factor. It is a 2D solution to a 3D problem.
The lower modes will be most evenly spaced with the cube root of 2 approach. (1: 1.260 : 1.587)
The table below shows this. It uses those ratios and is normalized to a dimension with 100 Hz for the first mode of the shortest dimension. The first 10 modes are shown.
1 1.26 1.587
100 79 63
200 159 126
300 238 189
400 317 252
500 397 315
600 476 378
700 556 441
800 635 504
900 714 567
1000 794 630
Where even this approach breaks down is that the higher modes start to overlap. For example the 4th harmonic of the "1" dimension is about the same as the 5th harmonic of the "1.26" dimension. (400 vs. 397)
Still this advice is given for room design because the goals are even spacing at the low end and eventualy enough modes per Octave are achieved (modal density is a desirable thing).
In the box case that we are talking about, if it mattered, we could be assured that upper range modes are dealt with via even minor damping and equal spacing of the low modes (as assured here) would be the best result.
David S.
Attachments
That I understood. I used the same equation but evaluated axial modes only.Dave,
My study simply solves the 3D Rayleigh equation
So you find the lowest average spreading? Most people look for evenness of interval.using p, q and r values from 0 to a large number (10 from memory) using all the combinations between p,q and r.
Then the frequencies are just sorted out. Then it is easy to have a statistical view of the spreading...
Sometimes that is the case.This method as yet been discussed since at least 10 years and your are the only one complaining about it.
You are still looking at two by two comparisons of the dimensions. If you had a room that had a fixed ceiling height, or height and width, this might make sense, but why not look for the solutions that give best results between all three dimensions. Again, you compare the first dimension to the second and second to third but not third to first. Please tell me if that is not true.What you are referring it doesn't concern spreading it concern overimposed frequencies (for different p,q, r values depending on the shape you may obtain a same resonance frequency).
I don't say that all the points on the red line are perfect but it the red line allows to save time in order to choose the sahpe (or to modify a given shape adding internal walls...)
The same garphical approach seems to have been both used (but with probably less data that mine) by Louden and by Japanese. See graph attached.
IMHO you exagerate the importance of surimposed resonances ... ( if you have such you have to break some modes by the proper acoustic treatment of your room...)
In rooms, where this has more importance, superimposed resonances are the key. The objective is to regularize the interval through the first few modes. A large gulf between modes will be perceived as a thin bass range. Overlapping modes will have greater strength than well spaced modes. Many a text tells you never to have integer multiples of dimensions (e.g. a length equal to twice the ceiling height).
For example, Everest spends a lot of time on the subject.
http://www.tecnosuono.org/private/f.... - Master Handbook of Acoustics - 5th ed.pdf
"A cubical room distributes modal frequencies in the worst possible way, piling all threefundamentals with maximum gaps between modes. Having any two dimensions in multiple relationship results in this type of problem. For example a height of 8 ft. and a width of 16 ft. ..." (p. 346)
That would be exactly your 1 : 2 relationship.
Regards,
David
I recall giggling at the first blueprint I saw calling out foundation dimensions down to 64ths. Never seen 125ths though. Metric dimensions cure all that and more of course.
In other news, the side room at my shop is one of those worst cases: 9.5' x 9.5' x 19' ... good at 32hz, wretched otherwise. Anything I hook up in there including talking on the phone is awful.
In other news, the side room at my shop is one of those worst cases: 9.5' x 9.5' x 19' ... good at 32hz, wretched otherwise. Anything I hook up in there including talking on the phone is awful.
Last edited:
Dave, that's not true. I don't care if modes are axial or oblical.Again, you compare the first dimension to the second and second to third but not third to first. Please tell me if that is not true.
The resonance frequencies of all the 220 modes I considered are sorted, that's all what is done...
About the eveness of resonances,I don't say that this is unimportant but I use myself another approach which comes from the reading of a paper written by Hiraga.
"Below 200Hz rooms for which there is more than 20Hz between 2 peaks of resonances sound bad. "
(BTW using such criterion leads to a good eveness.)
(Why 200Hz? It is because resonances tend to mutliply progressively over 200Hz and there is no more such large interval of frequencies as 20Hz)
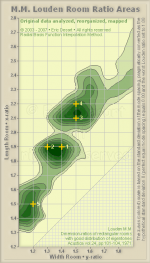
This method seems to give correct results as we can see if we put on my graph the points of the 10 best shapes of auditorium from Louden :
1 : 1.9 : 1.4
1 : 1.9 : 1.3
1 : 1.5 : 2.1
1 : 1.5 : 2.2
1 : 1.2 : 1.5
1 : 1.4 : 2.1
1 : 1.1 : 1.4
1 : 1.8 : 1.4
1 : 1.6 : 2.1
1 : 1.2 : 1.4
and the 3 good ones from L.W. Sepmeyer :
1 : 1.14 : 1.39
1 : 1.28 : 1.54
1 : 1.60 : 2.33
(See attached file).
Best regards from Paris, France
Jean-Michel Le Cléac'h
Attachments
Last edited:
Hello,
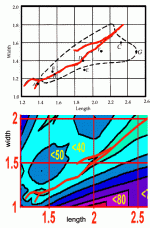
Here is a comparison at the same scale between my graph (at bottom) and the one shown by Everest in Fig 13.20 (on top).
(in the book http://www.tecnosuono.org/private/f.... - Master Handbook of Acoustics - 5th ed.pdf )
(the outer zone in the graph Fig 13.20 is related to Bolt criteria).
Best regards from Paris, France
Jean-Michel Le CLéac'h
Attachments
Last edited:
Hi Jean Michel,
I found this interesting discussion which compares a lot of room ratio scenarios.
Acoustics Forum • View topic - ROOM RATIOS
As I have looked at this some more I see that the 2D plot compares length to height and then width to height, on the two axies.
Where you and I first went off the rails was when you included a 2 : 1 ratio as one of your preferred ratios. As I have mentioned nearly everyone avoids exact integer ratios as many harmonics will "pile on" each other.
You keep repeating that you are looking for some criterion of spreading rather than preventing overlap. I find those to be essentially the same thing. Apparently Loudon looks for a low standard deviation of interval but this, too, will generally give low overlap. If we achieve equal spread of all frequencies (not possible) then we would have each dimension's modes falling into the intervals of the other two dimensions. Standard deviation of spread would approach 0.
Every discussion I have seen on the subject gives as a general guidline to have even spacing between modes if possible. The above web site plots various schemes and lists the number of modes per 1/3 rd Octave. A good approach, such as the C. P. Boner approach based on the cube root of 2, starts with a mode per 1/3rd Octave until upper frequencies, where the modal density naturally rises. This is exactly as I have been commenting on. Although an automatic criterion, such as standard deviation, is attractive, I really think you need to individually evaluate the proposed schemes, or at least find a way to reward good spacing in the first Octaves.
My understanding with Loudon is that he is minimizing the standard deviation of a large number of modes and losing the needed emphasis on the spacing of the lower modes. At higher frequencies the modal density is always good and the likely room damping is higher. At the same time furniture and natural diffusion will make a precise look at calculated modes unjustified. We really need to focus on the lower modes and achieving a good spread of them. As I recall, the axial modes are also felt to be more harmful than oblique modes.
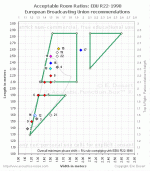
On your graph I see you plot a continuous locus of points. This is part of the problem. The range of points can not be continuous. If you look at the attached plots from EBU, they show some of the different recommended ratios from the various papers but hey also clearly show that the regions around the 2 :1 ratios must be no-go areas. Even your Loudon figures show a valley between the two adjacent maxima at the 2 to 1 line. Integer multiples are bad news!
Some major caveats on the whole subject:
All of these studies are theoretical and little has been done to prove that "correct" room ratios make a big subjective difference.
Rigid end walls are always assumed. In practice the walls are typically mass reactances with a loss component, and the Rayleigh equation becomes an oversimplification.
Upper modes would be especially variable with the presence of any doorways, absorption or furniture. Take any mode prediction above the 4th or 5th mode with a large grain of salt.
Finally, no one has given any evidence that similar thinking needs to be applied loudspeaker cabinets. Where a 1/4 wave thickness of stuffing may be somewhat impractical in your living room, it is no big deal in a speaker cabinet. Lining all sides and perhaps dealing with the longest dimension with a damping partition 1/2 way down the cabinet, is all that is ever called for.
Regards,
David S.
I found this interesting discussion which compares a lot of room ratio scenarios.
Acoustics Forum • View topic - ROOM RATIOS
As I have looked at this some more I see that the 2D plot compares length to height and then width to height, on the two axies.
Where you and I first went off the rails was when you included a 2 : 1 ratio as one of your preferred ratios. As I have mentioned nearly everyone avoids exact integer ratios as many harmonics will "pile on" each other.
You keep repeating that you are looking for some criterion of spreading rather than preventing overlap. I find those to be essentially the same thing. Apparently Loudon looks for a low standard deviation of interval but this, too, will generally give low overlap. If we achieve equal spread of all frequencies (not possible) then we would have each dimension's modes falling into the intervals of the other two dimensions. Standard deviation of spread would approach 0.
Every discussion I have seen on the subject gives as a general guidline to have even spacing between modes if possible. The above web site plots various schemes and lists the number of modes per 1/3 rd Octave. A good approach, such as the C. P. Boner approach based on the cube root of 2, starts with a mode per 1/3rd Octave until upper frequencies, where the modal density naturally rises. This is exactly as I have been commenting on. Although an automatic criterion, such as standard deviation, is attractive, I really think you need to individually evaluate the proposed schemes, or at least find a way to reward good spacing in the first Octaves.
My understanding with Loudon is that he is minimizing the standard deviation of a large number of modes and losing the needed emphasis on the spacing of the lower modes. At higher frequencies the modal density is always good and the likely room damping is higher. At the same time furniture and natural diffusion will make a precise look at calculated modes unjustified. We really need to focus on the lower modes and achieving a good spread of them. As I recall, the axial modes are also felt to be more harmful than oblique modes.
On your graph I see you plot a continuous locus of points. This is part of the problem. The range of points can not be continuous. If you look at the attached plots from EBU, they show some of the different recommended ratios from the various papers but hey also clearly show that the regions around the 2 :1 ratios must be no-go areas. Even your Loudon figures show a valley between the two adjacent maxima at the 2 to 1 line. Integer multiples are bad news!
Some major caveats on the whole subject:
All of these studies are theoretical and little has been done to prove that "correct" room ratios make a big subjective difference.
Rigid end walls are always assumed. In practice the walls are typically mass reactances with a loss component, and the Rayleigh equation becomes an oversimplification.
Upper modes would be especially variable with the presence of any doorways, absorption or furniture. Take any mode prediction above the 4th or 5th mode with a large grain of salt.
Finally, no one has given any evidence that similar thinking needs to be applied loudspeaker cabinets. Where a 1/4 wave thickness of stuffing may be somewhat impractical in your living room, it is no big deal in a speaker cabinet. Lining all sides and perhaps dealing with the longest dimension with a damping partition 1/2 way down the cabinet, is all that is ever called for.
Regards,
David S.
Attachments
- Status
- This old topic is closed. If you want to reopen this topic, contact a moderator using the "Report Post" button.
- Home
- Loudspeakers
- Multi-Way
- golden ratio. I dont get it