I had prepared a lengthy reply but I think things speak for themselves. By the way, in no way am I trying to steer people away form Earl's speakers. I'm sure he sells many more that I, as does SL. I do what I do purely as a hobby. And when I see something that doesn't jive with me I say so. It's my nature.
FWIW I have removed the polar data for the Nathan and the Orion from my site. I felt it in poor taste to post data for SL's speaker since I did not take it. Besides, you can all plot it up for your self. May I suggest that Mac delete the copy he posted here as well?
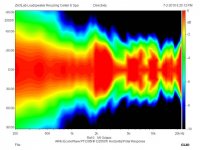
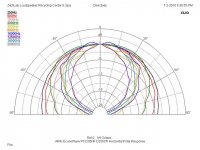
I will make one statement. The idea that normalizing a contour plot by the on axis response is a bad thing to do is nonsense. It is in fact the correct thing to do. Looking at the data for Earl's Abbey tells you why. It appears to have a very nice -6dB beam width from 2k and above. That is true if you don't care about what happens between +/- 40 degrees. On axis the response above 2K varies by as much as +/-4.75dB (3dB peak at 2.7k, 6.5dB dip at 5.8K). That's not me being critical of Earl's design. That is what he presented in his data. Earl says it's bad to normalize because the peaks and holes in the on axis response will distort the contours off axis. And let me add that the normalization by the on axis response in my case would have little effect because the on axis response is extremely flat.
FWIW I have removed the polar data for the Nathan and the Orion from my site. I felt it in poor taste to post data for SL's speaker since I did not take it. Besides, you can all plot it up for your self. May I suggest that Mac delete the copy he posted here as well?
I will make one statement. The idea that normalizing a contour plot by the on axis response is a bad thing to do is nonsense. It is in fact the correct thing to do. Looking at the data for Earl's Abbey tells you why. It appears to have a very nice -6dB beam width from 2k and above. That is true if you don't care about what happens between +/- 40 degrees. On axis the response above 2K varies by as much as +/-4.75dB (3dB peak at 2.7k, 6.5dB dip at 5.8K). That's not me being critical of Earl's design. That is what he presented in his data. Earl says it's bad to normalize because the peaks and holes in the on axis response will distort the contours off axis. And let me add that the normalization by the on axis response in my case would have little effect because the on axis response is extremely flat.
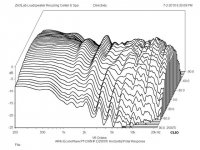
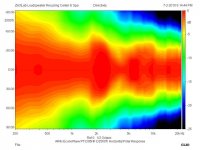
How much smoothing is actually occurring in the plots?
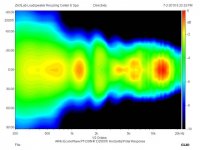
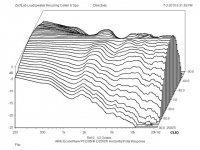
Here, 1/2 octave:
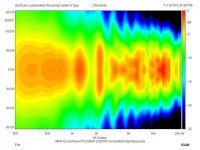
Here, 1/2 octave:
Attachments

Last edited:
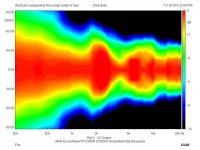
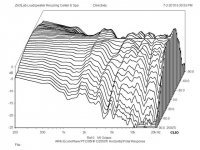
Here, same data at 1/6 octave:
Attachments
Last edited:
The idea that normalizing a contour plot by the on axis response is a bad thing to do is nonsense. It is in fact the correct thing to do.
Perhaps, so what if Dr Geddes was to normalise on listening axis rather than on speaker axis? Or what about normalising the power response?
At the frequency where there is a hole on axis due to the waveguide mouth termination, normalising on speaker axis only makes it look weird.
Earl chooses a protocol that shows his designs in the best light. His original directivity white paper displayed the on-axis notch in full relief. We all know it's there, we all know why it's there, and we are all well aware of his "I don't listen on axis and I don't EQ there" workaround.... 
Last edited:
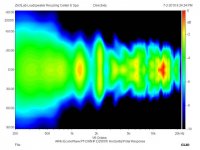
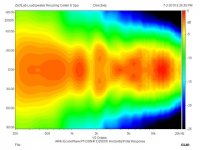
About color coding intensity in Earl's graph
Please have a look what other manufacturers are showing. In example Klein-Hummel has a very rough data by comparison. Every 3dB variation is blended in one color 'bin'.
In comparison Earl's data has 1/20oct freq. smoothing and infinitly variable color coding.
From Nathans data it is apparent that from 5000-10000Hz there is clearly visible 'depression' near 0 degree axis, judging from color appears same intensity as 40 degree data at that freq. region - how everyone misses it and accuses Geddes of 'hiding' data is beyon me.
On the other hand, making the color transitions faster in the frist couple dB would show a better picture of what happens to the sound field. As of now, ZilchLab's posted data is not comparable to Earl's posted data, because sound level intensity is represented differently - Zilch's graph has 10dB of range (red - black), while Earl's data has a whopping 35dB crammed to the red-black transition.
Asking Earl to color code his data differently is not fair either - every data point below a certain dB would be 'lost'
Maybe the most reasonable solution would be to use 20dB intensity range for color coding? ZilchLab-s data would show something beyond 50 degrees, Earls data would look more 'detailed' near the forward lobe. And most importantly, Klein-Hummel uses 20dB range for color coding polar maps")
Please have a look what other manufacturers are showing. In example Klein-Hummel has a very rough data by comparison. Every 3dB variation is blended in one color 'bin'.
In comparison Earl's data has 1/20oct freq. smoothing and infinitly variable color coding.
From Nathans data it is apparent that from 5000-10000Hz there is clearly visible 'depression' near 0 degree axis, judging from color appears same intensity as 40 degree data at that freq. region - how everyone misses it and accuses Geddes of 'hiding' data is beyon me.
On the other hand, making the color transitions faster in the frist couple dB would show a better picture of what happens to the sound field. As of now, ZilchLab's posted data is not comparable to Earl's posted data, because sound level intensity is represented differently - Zilch's graph has 10dB of range (red - black), while Earl's data has a whopping 35dB crammed to the red-black transition.
Asking Earl to color code his data differently is not fair either - every data point below a certain dB would be 'lost'
Maybe the most reasonable solution would be to use 20dB intensity range for color coding? ZilchLab-s data would show something beyond 50 degrees, Earls data would look more 'detailed' near the forward lobe. And most importantly, Klein-Hummel uses 20dB range for color coding polar maps
I had prepared a lengthy reply but I think things speak for themselves.
I will make one statement. The idea that normalizing a contour plot by the on axis response is a bad thing to do is nonsense.
John - in no way did I mean offense, you are one of the few people I will argue with. But I do disagree about normalization.
I would prefer that we compare data on all designs on an equal footing, not picking and choosing what we want to show. I still encourage you to supply me with data from your designs and I will post them. If normalization is what you require I will add that, even though I do not agree.
As someone else said, if you are going to normalize my data then do it along the axis that it is designed for. Anything else is just not right. That much should be obvious.
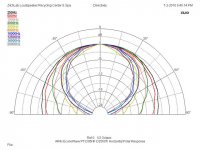
I chose that 10 dB full-scale resolution to clearly delineate the standard -6 dB partition. Here they are at 25 dB; 1, 5, 50 and 100 dB are also available in CLIO.On the other hand, making the color transitions faster in the frist couple dB would show a better picture of what happens to the sound field. As of now, ZilchLab's posted data is not comparable to Earl's posted data, because sound level intensity is represented differently - Zilch's graph has 10dB of range (red - black), while Earl's data has a whopping 35dB crammed to the red-black transition.
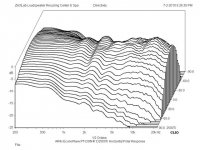
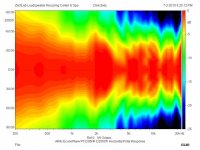
Smoothing options are unsmoothed, 1/12, 1/6, 1/3, and 1/2 octave. Normalization, axis, smoothing, and scaling each emphasize different features and flaws, but the bottom line is that the directivity itself as illustrated remains the same....
Attachments
Last edited:
About color coding intensity in Earl's graph..
It's a moot point. Lets just leave it to what it is: marketing that is both technically accurate and displays what Earl wants to display.
My intent is to have that user selectable, but alas, there is only so much that I can do. The posted software was a test, its a dead end as it stands, but is being developed much more completely in another package.About color coding intensity in Earl's graph
As to scaling, my 42 dB is miniscule compared to the sometimes 120 dB we see on some frequency response data (makes everything look flat). What should it be? Clearly, IMO, 10 dB is too small because -20 dB stuff is still quite audible - so why exclude it? RT60 is measured to -60 dB, is that correct? Hardly, since studies have shown that only the first 20-30 dB is audible. Maybe 42 dB is too large (but "whopping"? - I don't think so). The K&H 3 dB bins is also way too coarse. I used to use 4 dB scale to - 26 dB, maybe that's right? 10 dB - no way. I would argue for a total scale of between 30 and 40 dB, less is throwing away important data and more is too coarse to see whats going on. But I could accept anything in the range of 30-40 dB as this coincides very nicely with the studies of revberberation time.
I totally agree with coming to some common understanding of what is required however. Trusting manufacturers to find the right choice is certainly not a good idea.
My intent is to have that user selectable, but alas, there is only so much that I can do. The posted software was a test, its a dead end as it stands, but is being developed much more completely in another package.
Hello Dr. Geddes,
Is this package being developed to work directly with the Holmimpulse data? If so, that would be fantastic!
From my point of view holm is as good as is gets (and very complete) to make accurate measurements is a extremely straightforward way (every DIY can make good measurements with this software with only a little bit of practice). What is missing is more tools to analyze the measurements made. I am aware there are other packages available to analyze the captured data, but most of the time this is very labor intensive (export every single measurement to a single custom text file -> change header information -> import in another package -> configure the other package...) This takes rapidly about 30 min to get everything right (first time it takes a lot longer). This might not seem much to some people, but if you want to do this after every little adjustment to follow progress, this becomes way to much work. What I am looking for is something only a few mouse clicks away…
Ask did a marvelous job with Holmimpulse, but unfortunately; development stopped when Ask lost interest (or had way too much other work). Open source was never a possibility for his software, as much of the libraries used came from their commercial product (DSPre 1)
Looking forward to hear news from your developments,
Wim
Good point about showing intensity data to -40 dB. Another point would be, that Harman? has found that about 70 degree response looks almost like the total power response of the speaker.......
As to scaling, my 42 dB is miniscule compared to the sometimes 120 dB we see on some frequency response data (makes everything look flat). What should it be? Clearly, IMO, 10 dB is too small because -20 dB stuff is still quite audible - so why exclude it? RT60 is measured to -60 dB, is that correct? Hardly, since studies have shown that only the first 20-30 dB is audible. Maybe 42 dB is too large (but "whopping"? - I don't think so). The K&H 3 dB bins is also way too coarse. I used to use 4 dB scale to - 26 dB, maybe that's right? 10 dB - no way. I would argue for a total scale of between 30 and 40 dB, less is throwing away important data and more is too coarse to see whats going on. But I could accept anything in the range of 30-40 dB as this coincides very nicely with the studies of revberberation time.
I totally agree with coming to some common understanding of what is required however. Trusting manufacturers to find the right choice is certainly not a good idea.
Either way the eye is in my opinion sensitive to the red-yellow transition, so it is a good idea making the primary lobe mostly red in color and below -6dB region mostly yellowish. Another transition region could be -10dB - perceived half intensity. This could be yellow to green.
One other potential problem is that the resulting graph depends on how you normalize 0dB response. As is now, Summa is clearly normalised to a higher level than Abbey in your graphs - resulting in slightly broader 'red' region - at first the eye perceives that Abbey has narrower directivity.
Clearly there could be a more advanced normalisation algorithm than now.
These are couple points why with overlaid freq. response plots data could be easier to compare than with polar maps. Logarithmically spaced freq. and SPL data points are easy to interpret - how to map intensity to color is tricky.
John - in no way did I mean offense, you are one of the few people I will argue with. But I do disagree about normalization.
I would prefer that we compare data on all designs on an equal footing, not picking and choosing what we want to show. I still encourage you to supply me with data from your designs and I will post them. If normalization is what you require I will add that, even though I do not agree.
As someone else said, if you are going to normalize my data then do it along the axis that it is designed for. Anything else is just not right. That much should be obvious.
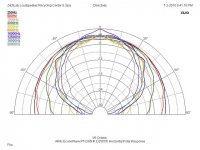
My point would be that you have effectively done just that, Normalized the data to the 40 or 45 degree axis. I don't know what your design axis for the Abbey is, but at +/-40 you have pretty flat response above 2k Hz, though somewhat depressed compared to that below 2k. It's like a newly paved super highway. But between +/-15 it's like a country road, quite uneven. I'm not being critical here, it is just what your data shows in black and white, or should I say living color? As I understand it, you recommend that your speakers be toed in by about 45 degrees. So where does that place a centered listener? If the listener were sitting centered at a distance equal to 1/2 that between the speakers he would be on the speakers 0 degree axis. If he were sitting at a distance equal to the distance between the speakers he would be at 15 degree off the 0 axis. With the speakers toed in by 45 degrees the centered listener would have to be sitting at a distance of over 5 1/2 time the distance between the speakers to be on the 40 degree axis. Additionally, and I am not trying to be critical or confrontational here, I'm just reiterating what you have said many times in the context of the data you have presented, you have frequently stated that your speakers are designed not for a single centered listener but to provide a uniform sound field over a wide listening window. In that case, regardless of what axis you choose to normalize the contours to, it is the polar response plots that tell the story. If the radiated sound is to be uniform over a wide window, then the polar response must be constant with frequency over that window. (A well designed dipole can doe that fairly well.) As a listener moves off center, with speakers toed in, he moves more off the 0 axis of one speaker and closer to it for the other.
Of course the shape of the polar plots is not a function of the axis chosen for normalization. If I look closely at my polar plots what I see is that at 45 degrees the response below 1k is nominally -3dB relative to the 0 axis and varies monotonically between 0 and 45, and further. In the region between 2 and 4k the 45 degree response is only about -2dB relative to the 0 axis. But it is still monotonic. Up at 8 k the response is down about 8dB at 45 degrees relative to the 0 axis. If I wanted flat response at 45 degree I could easily accomplish that by applying equalization which cuts the 0 axis response by 1 dB in the 2 to 4 k region and boosted the 8k response by 8 dB.
I understand if you don't want to normalize ob the 0 axis because that is not you design axis. But then perhaps your contours should be centered relative to the design axis? In any case, it is still the polar plots that tell the story because, as stated above, their shape is not a function of what response axis is chosen for normalization. The polar plots at different frequencies will then all converge at the design angle, but it is how that vary as the angle moves off the design point that is relevant.
The last point I would make is that of reflections. Your design approach is to minimize reflections form side walls. In that regard, and in consideration of your recommended placement, you have done a reasonable if not good job, at least above 1 or 2 kHz. He we certainly differ on the roll of such reflections. Certainly this is the reason why some people prefer speakers like yours while other prefer dipole and other open backed speakers. But I would still argue that with a dipole there are choices that are not available with a speaker such as your, or any other direct radiator speaker. The reflections form the wall behind the speaker and side walls are pretty easily controlled by room treatment, particularly above 1k Hz. So I have never seen those reflections as a problem.
Lastly, please don't think I am trying to convert people to NaO systems as opposed to yours. I really could care less. You sell speakers. I design speakers for the challenge and as a hobby and make the design, in the form of plans and a PCB, available to the DIY community, if interested. I get way more from the federal gov. collecting social security checks (and that ain't much) than I do from anything I do related to audio. I'm retired and quite comfortable. The last thing I need is another successful business.
One additional question which migh be helpful. Just what is your design axis?
Somewhere around 22° if I remember correctly.
It would be nice to show the equal level lines in user selectable options up to 1 db resolution resolution.My intent is to have that user selectable, but alas, there is only so much that I can do. The posted software was a test, its a dead end as it stands, but is being developed much more completely in another package.
As to scaling, my 42 dB is miniscule compared to the sometimes 120 dB we see on some frequency response data (makes everything look flat). What should it be? Clearly, IMO, 10 dB is too small because -20 dB stuff is still quite audible - so why exclude it? RT60 is measured to -60 dB, is that correct? Hardly, since studies have shown that only the first 20-30 dB is audible. Maybe 42 dB is too large (but "whopping"? - I don't think so). The K&H 3 dB bins is also way too coarse. I used to use 4 dB scale to - 26 dB, maybe that's right? 10 dB - no way. I would argue for a total scale of between 30 and 40 dB, less is throwing away important data and more is too coarse to see whats going on. But I could accept anything in the range of 30-40 dB as this coincides very nicely with the studies of revberberation time.
I totally agree with coming to some common understanding of what is required however. Trusting manufacturers to find the right choice is certainly not a good idea.
HTML:
As a listener moves off center, with speakers toed in, he moves more off the 0 axis of one speaker and closer to it for the other.Hello Dr. Geddes,
Is this package being developed to work directly with the Holmimpulse data? If so, that would be fantastic!
Looking forward to hear news from your developments,
Wim
My original intent was just what you say, but with Holm's non-development I am concerned. I agree that Holm is the best that I have used, but if its not going to be developed then I'll just impliment its features into my software. There is nothing proprietary or unknown about what Ask has done in Holm. It's all well know techniques. He just did a slick job on the interface. Using the same programming environment as he does, I can see how this happened. Its really quite straightforward with these modern development environments.
I have long needed a package that could do "precisely" what I need. I have used MathCAD for decades, but MathSoft was purchsed by a company who seem bent on destroying the product. So I am concerned about its future as well.
What I need to emphasize to everyone who shows all these other programs doing "similar" things is that what I am doing has never been done before and none of those other packages will do it. There is a massive amount of post data analysis done to get the plots the way that I show them. Those plots have 1 degree angular resolution (and NO its not just simple interpolation, that has been shown to be highly inaccurate for polar data, which is why no one does it). The frequency axis is linear, not log, again with a very high degree of resolution, and again, not simple interpolation.
I am also going to include a crossover simulator in my package, but I doubt that I would release this for free since my techniques are proprietary. What I will certainly do is incorporate as many designs as possible into my database. I may release the software for use on your own data, I have not decided yet, and won't until the programming is complete.
As I said my techniques are highly mathematical and sometimes are not so stable. They rely heavilily on modal decomposition and this is sometimes singular. I use SVD, but even then this sometimes fails to converge. I'm trying to understand what in the physics is causing such instability. Clearly a general purpose release would need to be stable or it would just be a headache for the user.
Those familiar with the JAES can note a recent article on modal radiation decomposition and a "Letter to the editor" from me on this same topic. If you are interested in what I am doing then read these two articles.
One additional question which migh be helpful. Just what is your design axis?
Generally between 15 and 30 degrees are targeted as the main listening angles - so about 22 degrees if a single number is needed.
Last edited:
- Home
- Loudspeakers
- Multi-Way
- Geddes on Waveguides