You bring an interesting point. How to best wire the speakers up: hook 5 speakers in parallel to a set, then hook five sets in series; or hook 5 speakers in series to a set, then hook up 5 sets in parallel. The second option might use fewer interconnects, and also ensure that outlier drivers don't pass more or less current than the others.I might be wrong, but from an electrical point of view it seems like the best thing to do would be to match the resistance/impedance of each string of 5 drivers in series. The reason for doing this is because you want the same current flowing through each leg of the parallel combination of 5 strings.
You already have the individual impedance plots of every driver so most of the hard work is already done.
The outliers in this graph were within 3% tolerance (DC resistance) with slightly different Fs impedance peaks. If the OP divided the drivers into matched sets by arranging them from lowest to highest fs peak frequency, then wire five set of series connected drivers in parallel, as opposed to randomly arranging all 25 drivers into a series-parallel configuration, would the difference in performance of the random set versus matched set arrays even be measurable, much less discernable?
They are all so close in tolerance anyway...
Last edited:
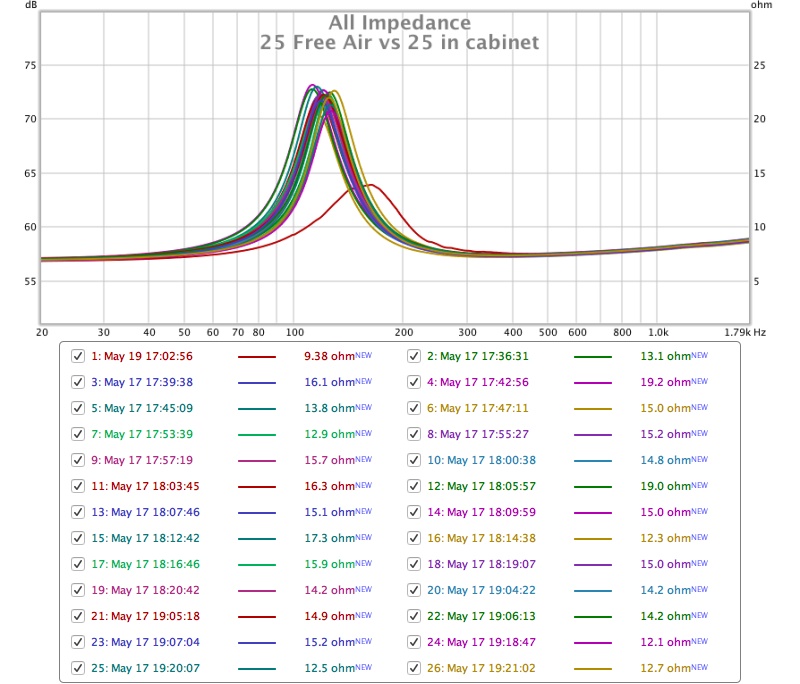
The close tolerance you saw in that graph was not based on the real difference. Its just where on the graph the pointer was placed in REW that is seen below the graph. Putting the cross hair on an impedance bump of one of the 25 drivers would show a lot more variation (obviously).
The 100 Ohm resistor is in the impedance jig as that measures the difference between both sides of it, in that case it is not a problem. When you play music through the jig to hear it the signal is going straight through the resistor in series. The O2 headphone amp is quite capable of driving very low resistances but the signal level does need to be reduced or the overall volume turned down as there is a limit to the power it can produce before distorting.Sorry I didn't realise you were using a 100 ohm series resistor. That will definitely cause peaking at fs on the impedance curve. A few headphone amps are capable of driving 8 ohm loads; though many are not and some will distort or the internal impedance of the amp will attenuate the output. Some use a shunt resistor to protect from shorts and the output drops off rapidly as the speaker impedance approaches the shunt value.
I might be wrong, but from an electrical point of view it seems like the best thing to do would be to match the resistance/impedance of each string of 5 drivers in series. The reason for doing this is because you want the same current flowing through each leg of the parallel combination of 5 strings.
You already have the individual impedance plots of every driver so most of the hard work is already done.
That was my thought to try and match the 5 groups as closely as possible given the information I already have.The only thing I can think of for the next one is to try and sort the drivers per sub enclosure to try and spread the variance,
I guess I'll be the only one not convinced that its the slight variation in separate driver impedance. For more info on that just look at the sims XRK did in my thread and how I was able to fix it by changing the baffle damping.
A good test would be to hook up the drivers without them beeing bolted down in the enclosure. Lay them on top of a couple of towels while keeping the electrical connection. Then re-run impedance free air with 25 drivers.
I'm not going to wire up all 25 in free air as it is a real pain to get the connectors on and off. I have bought ones that are exactly the right size for the tabs so it takes a lot of force to get them on and off and I fear for the life of the little piece of fibreglass and a rivet holding it all together!
I already have shown the difference between 5 wired in a form of series parallel in free air and the same 5 drivers when placed in the chamber I have. And that test shows what you are getting at that in free air they add together with no bumps. When placed in a cabinet you get more bumps, place 25 in a cabinet and the bumps move a bit. So I don't dismiss what you are saying.
I can't damp my baffle or change the way they are fixed down without some quite significant modifications which I am not going to do at this point in time.
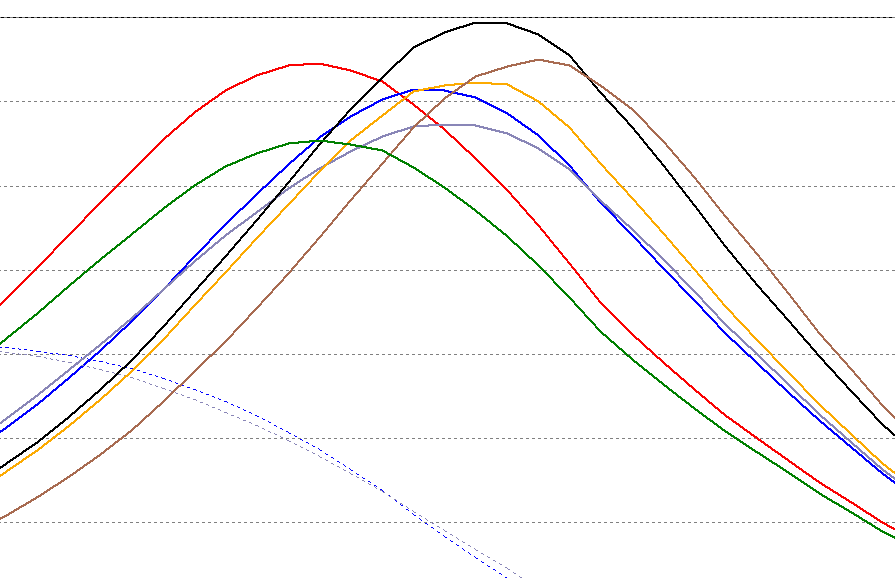
If you look at the graph of all the drivers individual impedances there is a trend for two peaks to appear at least to my eyes.
When I have tried to sort the drivers out there will be more data to analyse. If it makes no appreciable difference then what you say seems much more likely so we will see.
You bring an interesting point. How to best wire the speakers up: hook 5 speakers in parallel to a set, then hook five sets in series; or hook 5 speakers in series to a set, then hook up 5 sets in parallel. The second option might use fewer interconnects, and also ensure that outlier drivers don't pass more or less current than the others.
The way that I have wired these is the same as Roger Russell and it makes the most sense to me. I have seen another array where all the parallel connections were made separately instead of branching from a point. The wiring board in that project made my head spin just looking at it and I can't think that adding that much extra cable can be a benefit.
The Resonant Frequencies and Resistance at the peak do show more variation.The outliers in this graph were within 3% tolerance (DC resistance) with slightly different Fs impedance peaks. If the OP divided the drivers into matched sets by arranging them from lowest to highest fs peak frequency, then wire five set of series connected drivers in parallel, as opposed to randomly arranging all 25 drivers into a series-parallel configuration, would the difference in performance of the random set versus matched set arrays even be measurable, much less discernable?
They are all so close in tolerance anyway...
Code:
Serial     Fs       Rmax
GB15BJ1000 117.2   22.35
GB15BJ0634 121.7   21.66
GB15BJ0757 124.4   22.23
GB15BJ0660 126.3   21.66
GB15BJ0687 125.3   20.91
GB15BJ0696 120.8   22.04
GB15BJ1178 114.7   22.29
GB15BJ0598 125.3   21.22
GB15BJ0668 122.6   22.54
GB15BJ0676 118.1   21.03
GB15BJ0637 124.4   21.54
GB15BJ0678 120     20.72
GB15BJ0684 118.1   21.91
GB15BJ0656 120.8   21.35
GB15BJ0772 121.7   20.85
GB15BJ0627 126.3   22.48
GB15BJ0651 111.3   22.54
GB15BJ0690 115.5   20.85
GB15BJ0685 119     22.1
GB15BJ0793 119     21.03
GB15BJ0674 117.2   21.41
GB15BJ1183 126.3   21.72
GB15BJ0694 119     21.85
GB15BJ0854 121.7   21.72
GB15BJ0672 119 22.23That is not quite true, you are right that the legend changes when you place the cursor, but those measurements were opened without the cursor being placed on the X axis so I can only assume that REW defaults to displaying the lowest value for each which is as close to DC as can easily be measured. But you are absolutely correct that the variance is much greater at resonance as can be seen from the figures aboveThe close tolerance you saw in that graph was not based on the real difference. Its just where on the graph the pointer was placed in REW that is seen below the graph. Putting the cross hair on an impedance bump of one of the 25 drivers would show a lot more variation (obviously).
")
I have sorted the data in two different ways:
By resonant frequency to get the 5 groups to have the most similar frequency when averaged.
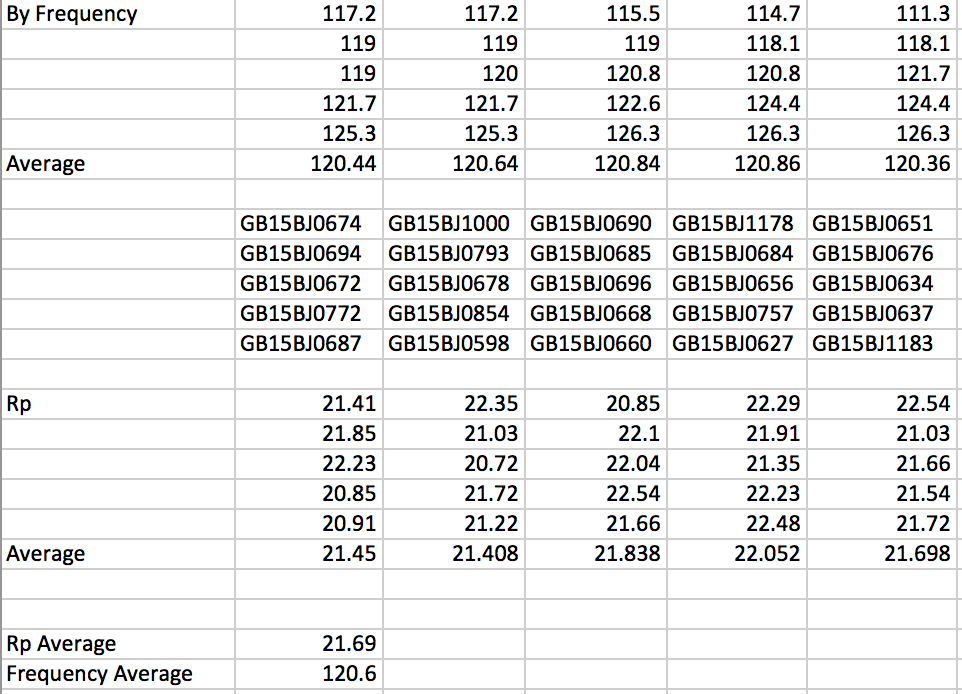
By Resonant Peak impedance value
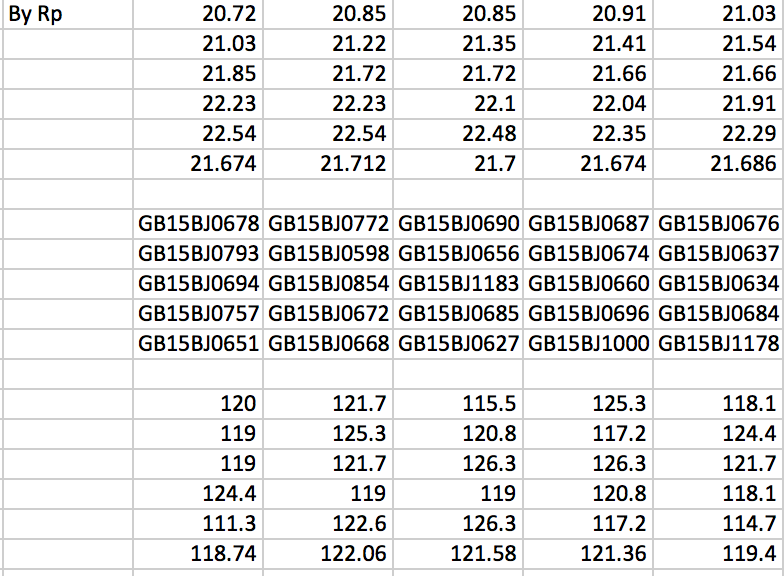
I think the sorting by frequency results in the best overall average. Now it remains to be seen if this has any effect on the tower or not, if only for intellectual curiosity
By resonant frequency to get the 5 groups to have the most similar frequency when averaged.
By Resonant Peak impedance value
I think the sorting by frequency results in the best overall average. Now it remains to be seen if this has any effect on the tower or not, if only for intellectual curiosity
Attachments


Hi fluid!
Awesome project
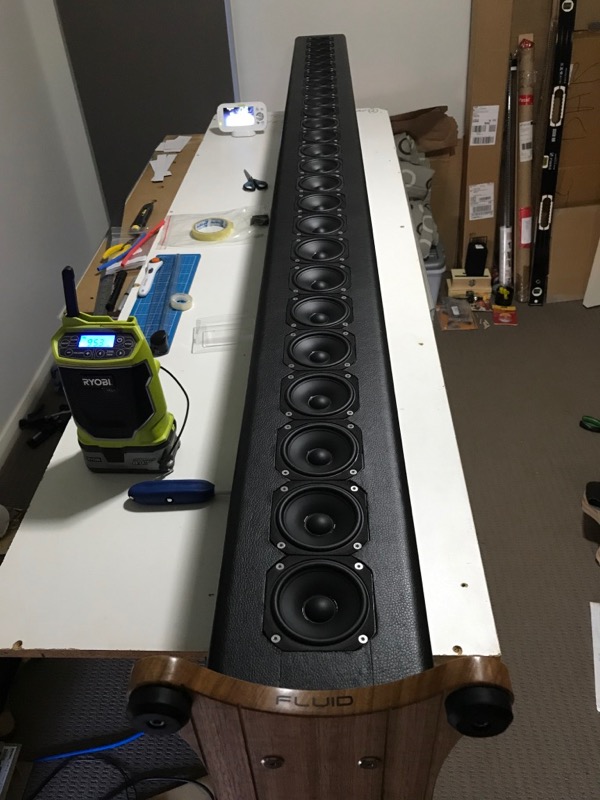
This makes me nostalgic... all that wiring and solder fumes and crouching over... working blind with your hands buried in a speaker enclosure, oh wait, that wasn't much fun was it?
I have a few tips for you and your impedance issue:
1. Break in the drivers before measuring impedance. This isn't a silly "it'll sound better after 100 hours of use" line. The impedance of the driver will shift somewhat from just a minute or two of full X-max LF tones. Run the tones for a minute, disconnect the driver, let it cool to room temp (an hour or so) then run the impedance sweep. Some drivers undergo extensive testing on the factory line, so this is less applicable for those, but these little Vifa's probably don't get much in the way of testing on the line given their price.
2. These little drivers are extremely sensitive to mounting, and need a very flat baffle so the baskets don't get bent. On my line, I had the tolerance on the drivers so close that I had to file down the edge of the basket on some drivers, this in turn put some pressure on the baskets, and caused the voice coils to rub on some of the drivers. If you are using thick gaskets, and the baskets are at all warped, then it's likely causing some of the coils to rub.
3. When wiring the drivers, use a 1.5V battery on each individual set of 5 parallel drivers to ensure you have the polarity correct. Use a 9V battery on the full array to ensure you have the entire array in phase. Using tones to check this visually is not possible (but it will mess with your head!), but a battery will give you nice positive way to identify cone excursion direction without damaging anything.
4. Once the entire array is done, use you 250W amplifier to feed a 10Hz tone to the array and increase the level until you get near X-max. Let it play for a minute or two and listen very closely to each driver for any voice coil rubbing. I had to replace 2 drivers in one array, and 3 in the other due to rubbing. A rubbing coil would definitely cause the impedance dip in your previous graph.
As for power, I can almost guarantee you will want the ncore amplifier. When I moved, I swapped from a 325W Anthem P2 to a smaller 150W amp an I miss the additional headroom in the low end. I was able to easily clip the Anthem P2 before the array ran out of excursion at low frequencies.
Best of luck with the project, and I'll be keeping an eye!
Cheers,
Owen
Awesome project
This makes me nostalgic... all that wiring and solder fumes and crouching over... working blind with your hands buried in a speaker enclosure, oh wait, that wasn't much fun was it?
I have a few tips for you and your impedance issue:
1. Break in the drivers before measuring impedance. This isn't a silly "it'll sound better after 100 hours of use" line. The impedance of the driver will shift somewhat from just a minute or two of full X-max LF tones. Run the tones for a minute, disconnect the driver, let it cool to room temp (an hour or so) then run the impedance sweep. Some drivers undergo extensive testing on the factory line, so this is less applicable for those, but these little Vifa's probably don't get much in the way of testing on the line given their price.
2. These little drivers are extremely sensitive to mounting, and need a very flat baffle so the baskets don't get bent. On my line, I had the tolerance on the drivers so close that I had to file down the edge of the basket on some drivers, this in turn put some pressure on the baskets, and caused the voice coils to rub on some of the drivers. If you are using thick gaskets, and the baskets are at all warped, then it's likely causing some of the coils to rub.
3. When wiring the drivers, use a 1.5V battery on each individual set of 5 parallel drivers to ensure you have the polarity correct. Use a 9V battery on the full array to ensure you have the entire array in phase. Using tones to check this visually is not possible (but it will mess with your head!), but a battery will give you nice positive way to identify cone excursion direction without damaging anything.
4. Once the entire array is done, use you 250W amplifier to feed a 10Hz tone to the array and increase the level until you get near X-max. Let it play for a minute or two and listen very closely to each driver for any voice coil rubbing. I had to replace 2 drivers in one array, and 3 in the other due to rubbing. A rubbing coil would definitely cause the impedance dip in your previous graph.
As for power, I can almost guarantee you will want the ncore amplifier. When I moved, I swapped from a 325W Anthem P2 to a smaller 150W amp an I miss the additional headroom in the low end. I was able to easily clip the Anthem P2 before the array ran out of excursion at low frequencies.
Best of luck with the project, and I'll be keeping an eye!
Cheers,
Owen
Hi fluid!
Awesome project
This makes me nostalgic... all that wiring and solder fumes and crouching over... working blind with your hands buried in a speaker enclosure, oh wait, that wasn't much fun was it?
I have a few tips for you and your impedance issue:
Hi Owen,
Thanks for dropping by, as you can probably see my project has a lot in common with your line array, and the information you posted on it played a part in the design decisions I made.
And you are right there is a lot of work in building an array
Have you got any impedance measurements of your array to compare?
1. Makes a lot of sense but I am a little too far in to do that now. The tests of the individual drivers were really to make sure that they weren't totally broken before I used them.
2. The baffle is very flat as it was CNC machined. I am using weather stripping as a gasket so it compresses fairly well. The drivers fit tightly into the cutouts but there is a tiny gap all the way round. I have tried to apply as equal pressure as I can to the screws but it is possible that the mounting has caused some of the voice coils to rub so that will be something I need to investigate when I have it connected to a proper amp. Mounting method and damping is something wesayso has suggested.
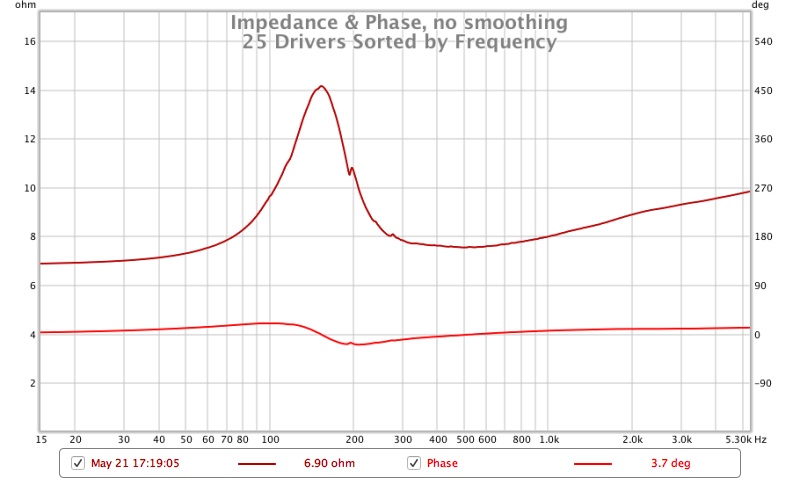
This is a close up of the peak to give a clearer view of what is being measured
3. I have done that already on the individual drivers and they all gave a forward motion for positive voltage on the positive terminal, I still need to test the total array but given the way I have wired it I don't see how any driver could have ended up wired differently.
4. Loosening up the drivers with tones is a good idea and the next step for the already wired speaker. What did a rubbing voice coil sound like?
The bigger amplifier I have is the UcD not ncore and it is in an 8 channel amplifier for another speaker. It will be useful for testing but I didn't prefer it to the First One amps I have in a previous listening test so it will be interesting to see the difference this time around.
Attachments

Hi fluid,
I'm certainly not suggesting taking the array apart! The best thing to do is just run the low frequency tones and check for rubbing. If there is no rubbing, then I would just give them some time to break in (as an array) and run the impedance test again. If the polarity is all correct, there is no coil rub, and no leaks in the enclosures then I don't think there is anything to worry about.
Attached here is the impedance sweep from my array. There's a single driver vs. the entire array of 25 drivers. They are wired up as 5 sets in parallel per enclosure, and then all 5 subsets wired in series. to get back to 8 ohms. I tested both arrays, but I can't find the second measurement. I do know both looked identical, and I was surprised how close the 25 driver array was to a single driver! Just a bit more "spread" or a lower Q overall. No hint of a dip.
Regards,
Owen
Attachments

Interesting, Owen! This may show the difference between wiring schemes. Technically or theoretically I can see the advantage.
5x parallel connected drivers wired as 5 series is bringing impedance down (5x parallel) and up again (5 in series).
5x series connected drivers then put in 5 parallel is bringing impedance up (5x series) before getting it back down again (5 in parallel).
I've always wondered how big of a difference there would/could be. I used the second wiring option as I couldn't figure out a few things that might happen. But I always kept wondering what if...
From fluid's image, that's a 0.5 ohm change over 68 ohms, that's 0.73%. What is the tolerance of your calibration resistor? I still think that it comes from paralleling 25 drivers, but it could be something else also like a measurement artifact, or some sort of resonant cancellation. Could you post the same image with the impedance of individual drivers overlayed? Hope that's not asking too much.
Surprised setting the two wiring schemes up into XSim gives a bit difference in frq variation and notch height, blue curve is 5x parallel connected drivers wired as 5 series and grey curve is 5x series connected drivers then put in 5 parallel, impedance plot #2 show same as plot #1 except driver S1-S5 is also presented to show the 5x difference free air drivers that is used into this exercise for every string of 5x drivers, for info frq scale in impedance plots is set 60-300Hz.
Based these two gives a difference could imagine into simulation if instead of using perfect wires we set some real world RLC per distance of wires we will start maybe to see same scheme as Fluid measure. Fluid i hang on this XSim file if you interested do the real world cable RLC experiment or could you tell me your cables RLC data. Could imagine that because the 5x series connected drivers are tapped at different points down the distance of one common wire could give some small weakness when real world RLC data is set into simulation.
Based these two gives a difference could imagine into simulation if instead of using perfect wires we set some real world RLC per distance of wires we will start maybe to see same scheme as Fluid measure. Fluid i hang on this XSim file if you interested do the real world cable RLC experiment or could you tell me your cables RLC data. Could imagine that because the 5x series connected drivers are tapped at different points down the distance of one common wire could give some small weakness when real world RLC data is set into simulation.
Attachments


Thanks for the information and comments guys, lots to think about there
Is this the graph you wanted?
The cable is 12 ohms per km and 115 pF per metre. No inductance given.

There is approximately 450mm of cable per enclosure for the parallel connections so as it goes up the line each string of series drivers is connected by a different length of cable. All series drivers are connected by the same short jumper wire of the same length so that should not be a factor.
That sounds like a good course of action. I am interested to see if I can get a change from a sorted set of drivers as there is obviously some difference due to the different wiring schemes. It will also be interesting to see how things change after the drivers have been loosened up a bit.Hi fluid,
I'm certainly not suggesting taking the array apart! The best thing to do is just run the low frequency tones and check for rubbing. If there is no rubbing, then I would just give them some time to break in (as an array) and run the impedance test again. If the polarity is all correct, there is no coil rub, and no leaks in the enclosures then I don't think there is anything to worry about.
That is interesting. In a mathematical summation there should be no difference between the wiring schemes but with real world impedance there is. I remember reading you say to avoid series connected drivers in the same enclosure and that being one of the reasons for breaking up the cabinet into sections. Not sure how I got it backwards in my head but I seem to have done the opposite and have all series connected driver's connected together in a common volume! That also makes me think that there is more likelihood of getting a change from sorting the drivers, but it also opens the question which parameter is best to sort them by to reduce the variance from the series connected drivers? The enclosure damping I have used has really lowered the peak but in yours it is still very high, what sort of damping did you use?Attached here is the impedance sweep from my array. There's a single driver vs. the entire array of 25 drivers. They are wired up as 5 sets in parallel per enclosure, and then all 5 subsets wired in series. to get back to 8 ohms. I tested both arrays, but I can't find the second measurement. I do know both looked identical, and I was surprised how close the 25 driver array was to a single driver! Just a bit more "spread" or a lower Q overall. No hint of a dip.
On these tests the value is 100.5 Ohms measured from a string of 4 series/parallel connected 100 Ohm resistors. It is the exact same setup that has been used on all the other measurements which haven't shown any measurement anomalies. There was a slight wiggle in the 5 driver test which had some series connected drivers but less of them. I have some other resistors I can use for the impedance test to see if there is any change. I did run the sweep about 5 times to see if anything changed and they were all exactly the same, so if it is due to measurement issues it is very repeatable!From fluid's image, that's a 0.5 ohm change over 68 ohms, that's 0.73%. What is the tolerance of your calibration resistor? I still think that it comes from paralleling 25 drivers, but it could be something else also like a measurement artifact, or some sort of resonant cancellation. Could you post the same image with the impedance of individual drivers overlayed? Hope that's not asking too much.
Is this the graph you wanted?
Thanks for doing that Byrtt it is very helpful. I see the same pushing to the right of the impedance peak on my measurements.Surprised setting the two wiring schemes up into XSim gives a bit difference in frq variation and notch height, blue curve is 5x parallel connected drivers wired as 5 series and grey curve is 5x series connected drivers then put in 5 parallel, impedance plot #2 show same as plot #1 except driver S1-S5 is also presented to show the 5x difference free air drivers that is used into this exercise for every string of 5x drivers, for info frq scale in impedance plots is set 60-300Hz.
Based these two gives a difference could imagine into simulation if instead of using perfect wires we set some real world RLC per distance of wires we will start maybe to see same scheme as Fluid measure. Fluid i hang on this XSim file if you interested do the real world cable RLC experiment or could you tell me your cables RLC data. Could imagine that because the 5x series connected drivers are tapped at different points down the distance of one common wire could give some small weakness when real world RLC data is set into simulation.
The cable is 12 ohms per km and 115 pF per metre. No inductance given.
There is approximately 450mm of cable per enclosure for the parallel connections so as it goes up the line each string of series drivers is connected by a different length of cable. All series drivers are connected by the same short jumper wire of the same length so that should not be a factor.
Attachments

Hope wiring and schematic setup for simulation is done right please check that, but myself was wrong thinking using real world cable RLC data would give better picture and start looking Fluid's measurements : )
Even i did use lower values XSim looked like wasn't so glad setting capacitors lower than 100pF but it doesn't matter because setting it at 100pF and even much higher would just pull resonance a very very little bit to left side.
Guessed above 450mm was meant as total 4500mm cable for parallels meaning 2,25 meter wire for hot and 2,25 meter for cold. Divided with five sections meaning 45cm from terminals to first 5x set of drivers and then 45cm again to next 5x set of drivers and etc. That means 54pF per 45cm section and taking inductance data from a comparable Supra cable it ended up 0,18uH per 45cm section, and resistance is set 5,4mOhm per 45cm section. There is no resistors visible in below and that is because all the inductors is set to have their ESR at 5,4mOhm.
This time the wiring scheme used by opc (5x parallel connected drivers wired as 5 series) is not presented, the two schemes presented is both 5x series connected then put in 5 parallel but one is with cables RLC data and the other without. Blue curve is with cable RLC data and grey curve without, in they so close and that XSim have limited feature to present impedance window then had to export as zma file and use REW to zoom into the very small differences.
Even i did use lower values XSim looked like wasn't so glad setting capacitors lower than 100pF but it doesn't matter because setting it at 100pF and even much higher would just pull resonance a very very little bit to left side.
There is approximately 450mm of cable per enclosure for the parallel connections so as it goes up the line each string of series drivers is connected by a different length of cable. All series drivers are connected by the same short jumper wire of the same length so that should not be a factor.
Guessed above 450mm was meant as total 4500mm cable for parallels meaning 2,25 meter wire for hot and 2,25 meter for cold. Divided with five sections meaning 45cm from terminals to first 5x set of drivers and then 45cm again to next 5x set of drivers and etc. That means 54pF per 45cm section and taking inductance data from a comparable Supra cable it ended up 0,18uH per 45cm section, and resistance is set 5,4mOhm per 45cm section. There is no resistors visible in below and that is because all the inductors is set to have their ESR at 5,4mOhm.
This time the wiring scheme used by opc (5x parallel connected drivers wired as 5 series) is not presented, the two schemes presented is both 5x series connected then put in 5 parallel but one is with cables RLC data and the other without. Blue curve is with cable RLC data and grey curve without, in they so close and that XSim have limited feature to present impedance window then had to export as zma file and use REW to zoom into the very small differences.
Attachments


Last edited:
Thanks for doing that Byrtt. The only thing that might make a difference is how the capacitors are wired. I would have thought to put the inductor and capacitor inline and take the output to the drivers from the same point on the capacitor not either side of it as it looks now. I have never used Xsim so that may make no difference.Hope wiring and schematic setup for simulation is done right please check that, but myself was wrong thinking using real world cable RLC data would give better picture and start looking Fluid's measurements : )
I am not surprised that there is little difference at low frequencies from the cable parameters, I imagine the difference is just that the series resistance lowers the overall result. The combination of R and C is more of an issue at high frequencies where it acts as a low pass filter. It would need to be an awful cable to have a significant effect though.
I have got the drivers sorted into 5 groups ready to go into the other tower so hopefully later I will find out if that made any difference
Attachments

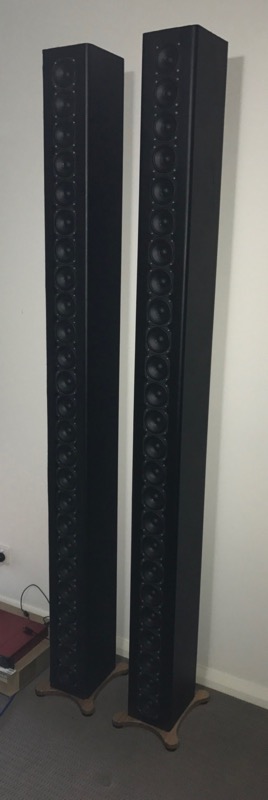
Here are a couple of pictures of the second speaker finished and both together side by side.
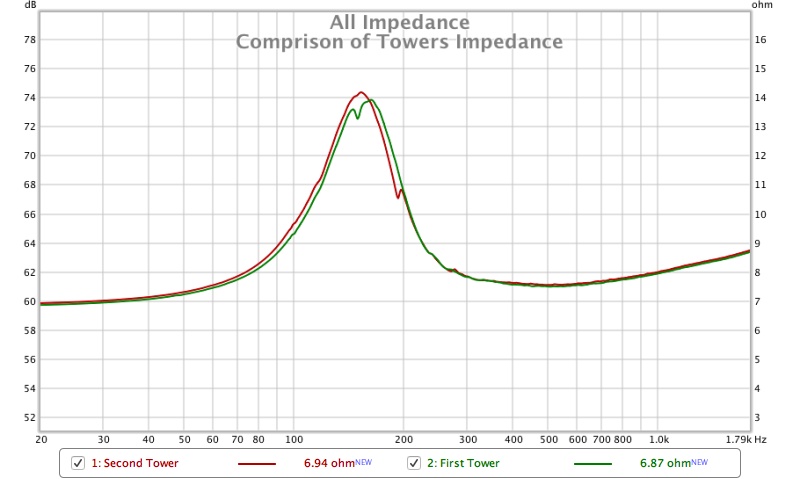
I did an impedance test on the second speaker before it has been broken in to compare to the first. This one has the drivers sorted as per the spreadsheet I showed before.
The result is interesting in that the dip has moved from around the peak to further up in frequency. Still thinking about why and what it means but it was at least different and therefore not a total waste of my time!
Comparison of the two overall impedance results. Pretty consistent all things considered.
Next step is to get some tones played through them to loosen everything up before measuring again
Attachments


I got the UcD amp and Najda setup to play some test tones through the first speaker. I started gently and then went down to 10 Hz gradually increasing the volume until the cones started to move a fair way. I did reach a point where there was a noise other than the tone and backed off. I needed to set REW to -3dB and was at about -6dB on the Najda at 1.5V.
I did some tests on the Najda to find out how much input attenuation I needed to avoid clipping on the Rudimental track that has the highest level of very low bass in my collection. It turned out to be -12dB.
I set up a preset to sum the stereo to mono to listen to one speaker at a time.
I couldn't resist playing some music so I tried it without EQ first, that lasted about 20 seconds
Then I loaded up the rough EQ that was based on wesayso's graph. It is not perfect and I can hear some areas that are not quite right yet but it was really good I found a spot in the room near the door where I could listen off axis about 2 to 2.5 metres away and I started to smile. I listened to music standing up for the next hour or so and only stopped because I was called away to family duties. I have no doubt that with a bit of effort I can get better results but even if I had to settle for this I would be happy. So no buyer's remorse
One benefit I hadn't really thought of before is that it sounds just as good stood up as it does sat down. Most speakers can't do that.
I can't hear any voice coil rubbing, either when the low tone was being played or by manually moving the cones with my fingers so hopefully I have escaped that fate. Distortion plots should be the final test when I get to that.
I did some tests on the Najda to find out how much input attenuation I needed to avoid clipping on the Rudimental track that has the highest level of very low bass in my collection. It turned out to be -12dB.
I set up a preset to sum the stereo to mono to listen to one speaker at a time.
I couldn't resist playing some music so I tried it without EQ first, that lasted about 20 seconds
Then I loaded up the rough EQ that was based on wesayso's graph. It is not perfect and I can hear some areas that are not quite right yet but it was really good
I found a spot in the room near the door where I could listen off axis about 2 to 2.5 metres away and I started to smile. I listened to music standing up for the next hour or so and only stopped because I was called away to family duties. I have no doubt that with a bit of effort I can get better results but even if I had to settle for this I would be happy. So no buyer's remorse One benefit I hadn't really thought of before is that it sounds just as good stood up as it does sat down. Most speakers can't do that.
I can't hear any voice coil rubbing, either when the low tone was being played or by manually moving the cones with my fingers so hopefully I have escaped that fate. Distortion plots should be the final test when I get to that.
I took another impedance measurement to see if there was any change after loosening the drivers a little. Not really but the dip is now bigger. I think I need to break them in more and then check again.
Attachments

- Home
- Loudspeakers
- Full Range
- Full Range TC9 Line Array CNC Cabinet