One thing that is probably worth a try is to use the Mortite blobs, but space them about 1~2 cm apart in a pattern similar to the EnABL pattern and see how the results come out. This is using mass and damping characteristics of the material. Each blob probably 5mm in diameter and 1~2 mm thickness.john k... said:
Well, I'm not trying to tune anything. I chose the driver I did because it obviously had a host of high frequency breakup problems. Thus it was a perfect candidate for investigating how different patterns of different damping materials affects these break up modes. If it is neceassary to optimize the treatment for evey different cone shape/material/size then you can hardly call this a unique treatment at all. It's just finding the optimum damping of the cone by trial and error. Nothing wrong with that, butit's just another audiophile tweak, IMO. I do agree with you on the high frequency side but if you look at the FR plots form the data I posted you will see that the rubberized coating was evey effective at eliminating resonances above 10k Hz. Below 10K there is some damping but there is also a frequency shift of the resonances which is consistent with the more or less uniform addition of mass.
For who ever asked, here is a drawing of the square treatment. You get the idea.
An externally hosted image should be here but it was not working when we last tested it.
BudP said:There is nothing to "give up on". This investigation is just bound to be a tumultuous process, but it is rooted in physical reality. Not a whit of magic attached.
If anyone want magic then look no further

http://www.holfi.com/?m=products&id=127f226a-f65f-45d1-8e01-a5793d56efb7
planet10 said:
That does pre-suppose a mode of operation and necessarily bias the test. It still does generate useful data.
dave
Absolutely. But the presupposed mode of operation is one which was expressed in Bud's Positive Feedback article. Then again, if you can observe the damping of resonances then it follows that other types of spurious wave motion is also being damped. Take a closer look at the very first CSD plot I posted at http://www.musicanddesign.com/Enable.html and compare it to the Mortite 3 or 4 CSD. Focus on the higher frequency response above 10k. Notice that not only is the response above 10k smoother, but the decay is faster and more uniform, at all frequencies above 10k, not just where there were resonances.
Because diaphragm has near continuous energy input, what I want to see is a distribution of all radiation across the diaphragm before and after treatment. A sort of power spectrum for each small area of the diaphragm which can be mapped onto the whole diaphragm.
Frank, what you want to see is exactly what I indicated in response to ronc's post. If you measure the response of the cone to an impulse using a laser over a grid of 20 radial points and 20 circumferential points what you have is 400 continuous time impulse responses that you can process in anyway you like. Put them together to form an animation of the cone motion, perform an FFt of each of them to get the frequency response at each point, do CSD plots on a point by point basis, compute the intensity at each point, ...., sum them all and get the impulse response of the driver (approximately). Repeat the process for different treatments and you will have detailed information about the effect. We end up with the transfer function of each small area of the cone corresponding to the grid locations. But you have to do the correct test with the correct stimulus.
http://en.wikipedia.org/wiki/Laser
I do recall that some sort of algorithm was necessary for high frequencies due to laser noise in the Klippel system.john k... said:
...
Frank, what you want to see is exactly what I indicated in response to ronc's post. If you measure the response of the cone to an impulse using a laser over a grid of 20 radial points and 20 circumferential points what you have is 400 continuous time impulse responses that you can process in anyway you like. Put them together to form an animation of the cone motion, perform an FFt of each of them to get the frequency response at each point, do CSD plots on a point by point basis, compute the intensity at each point, ...., sum them all and get the impulse response of the driver (approximately). Repeat the process for different treatments and you will have detailed information about the effect. We end up with the transfer function of each small area of the cone corresponding to the grid locations. But you have to do the correct test with the correct stimulus.
http://en.wikipedia.org/wiki/Laser
john k... said:
Absolutely. But the presupposed mode of operation is one which was expressed in Bud's Positive Feedback article. Then again, if you can observe the damping of resonances then it follows that other types of spurious wave motion is also being damped. Take a closer look at the very first CSD plot I posted at http://www.musicanddesign.com/Enable.html and compare it to the Mortite 3 or 4 CSD. Focus on the higher frequency response above 10k. Notice that not only is the response above 10k smoother, but the decay is faster and more uniform, at all frequencies above 10k, not just where there were resonances.
http://en.wikipedia.org/wiki/Laser
I vote for MorTITE!
Hi John,
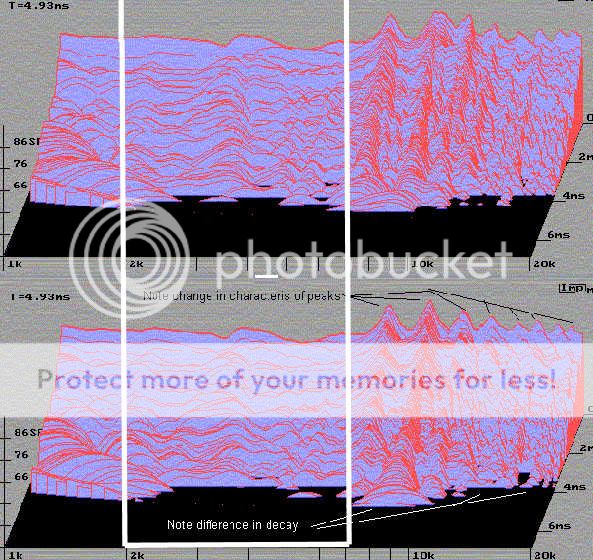
I wonder if we are looking at the wrong area in your results. What I noticed in comparing your clean driver and the EnABL'd one below it is the changes in the upper midrange, from about 2khz to 7khz or so. It appears to my untrained eye that the decay is faster, the decay lines are more uniform (less peaking in the lines) and the lines are more consistently spaced than in the untreated driver.
I believe our ears are more likely to pick up differences in this area than in the top end, especially when it comes to spatial location and one thing often reported with EnABL is a change in imaging or soundstage. Might smaller changes in this range of frequencies have a more noticable effect in listening tests?
No argument Dan. The different treatments have different effects at different frequencies. Mortite 1 is probably the best over all with everything below the lower limit of the plot by 4 msec. But it doesn't do as well at higher frequencies with regard to damping resonances. As I said, you have to take this for what its worth.
The problem I see with any treatment is that it is a tweak and if it can't be undone you are going to destroy a lot of drivers before finding what is optimal. That is why I used a metal cone. On a paper cone and whizzer, how are you going to get acrylic paint off it after it penetrates the surface of the paper?
An externally hosted image should be here but it was not working when we last tested it.
The problem I see with any treatment is that it is a tweak and if it can't be undone you are going to destroy a lot of drivers before finding what is optimal. That is why I used a metal cone. On a paper cone and whizzer, how are you going to get acrylic paint off it after it penetrates the surface of the paper?
Yes, they use time domain averaging, on the order of 100 runs per recorded sweep, which gives ~20dB more SNR. Also, the sweep has a quadratically increasing amplitude with frequency to produce reasonable displacment at HF.soongsc said:I do recall that some sort of algorithm was necessary for high frequencies due to laser noise in the Klippel system.
http://www.klippel.de/pubs/Klippel papers/Measurement_and_Visualization_Cone_vibration_06.pdf
- Klaus
Words of wisdom.Nordic said:Heard an interesting line today that made me think of this thread...
Absence of proof does not mean proof of absence.
dlneubec said:What I noticed in comparing your clean driver and the EnABL'd one below it is the changes in the upper midrange, from about 2khz to 7khz or so. It appears to my untrained eye that the decay is faster, the decay lines are more uniform (less peaking in the lines) and the lines are more consistently spaced than in the untreated driver.
Here is a comp of those 2 charts to enable easier comparison... red is clean. Blue (EnABL) on top so anywhere you only see blue means that the red curve is right underneath.
dave
Attachments
Thanks for the overlays Dave. There are a little bussy, but you gave me an idea. If you load my web page
http://www.musicanddesign.com/Enable.html
when you move the mouse over one of the CSD plots the Clean Driver CSD plot will appear. Moving the mouse off the plot and the CSD for the treated driver appears. This shows very dramatically the change due to the treatmnet. You will see the differences in deacy, changes in resonant frequencies and changes in resonance Qs. Very dramatic.
One thing I find distrubing is that the full enable treatment, in this case, tended to make the first few resonance higher Q and more defined.
I also added a CSD at the bottom which compares Mortite 1(mouse off) with Full Enable (mouse on).
Make sure you give the page time ot load fully. It can yake a while with dial up.
Cool way to display it.john k... said:Thanks for the overlays Dave. There are a little bussy, but you gave me an idea. If you load my web page
http://www.musicanddesign.com/Enable.html
when you move the mouse over one of the CSD plots the Clean Driver CSD plot will appear. Moving the mouse off the plot and the CSD for the treated driver appears. This shows very dramatically the change due to the treatmnet. You will see the differences in deacy, changes in resonant frequencies and changes in resonance Qs. Very dramatic.
One thing I find distrubing is that the full enable treatment, in this case, tended to make the first few resonance higher Q and more defined.
I also added a CSD at the bottom which compares Mortite 1(mouse off) with Full Enable (mouse on).
Make sure you give the page time ot load fully. It can yake a while with dial up.
The image swap with the cursor is helpful. I'll have to remember that for new pages where it would be useful.
The same thing occurs when tweaking the surround directly the way manufacturers have for more than a decade. The mod I made to the Insignia was inspired by the better drivers that often were treated this way. Since the issue is the mechanical impedance at the junction and it being a complex one, it's frequency dependent (as you know) and will not IME show uniform change across the spectrum when treated, just as you show for your tests of diaphragm mods.
I noted the same issues in my writeup of that Insignia mod. Some areas showed some detrimental changes, but the passband being the focus and most important aspect, my copying of the manufacturers' commonly found "tweak" shows some resonances being reduced while some had higher magnitude and Q.
The major first resonance mode around 1KHz is greatly improved, but the upper area resonances are made a bit worse with very little change at the top end. Since this is a mid-woofer, the crossover will help by pushing all of the upper area down into the stop band, of course. The changes in the distortion amplification of non-linear motor distortion and harmonic distortion I never measured. I still have the original MLS measurements and could show the harmonic distortion that LAUD extracts from them, but it's going to be limited to the lower orders due to the 48K sampling frequency.
Interestingly, there's essentially no change at all above about 9K for this driver. It's a woven diaphragm driver, so the upper breakup seems to be defined almost exclusively by the properties of the diaphragm totally isolated from the surround, or so it appears.
Dave
john k... said:One thing I find distrubing is that the full enable treatment, in this case, tended to make the first few resonance higher Q and more defined.
The same thing occurs when tweaking the surround directly the way manufacturers have for more than a decade. The mod I made to the Insignia was inspired by the better drivers that often were treated this way. Since the issue is the mechanical impedance at the junction and it being a complex one, it's frequency dependent (as you know) and will not IME show uniform change across the spectrum when treated, just as you show for your tests of diaphragm mods.
I noted the same issues in my writeup of that Insignia mod. Some areas showed some detrimental changes, but the passband being the focus and most important aspect, my copying of the manufacturers' commonly found "tweak" shows some resonances being reduced while some had higher magnitude and Q.
The major first resonance mode around 1KHz is greatly improved, but the upper area resonances are made a bit worse with very little change at the top end. Since this is a mid-woofer, the crossover will help by pushing all of the upper area down into the stop band, of course. The changes in the distortion amplification of non-linear motor distortion and harmonic distortion I never measured. I still have the original MLS measurements and could show the harmonic distortion that LAUD extracts from them, but it's going to be limited to the lower orders due to the 48K sampling frequency.
Interestingly, there's essentially no change at all above about 9K for this driver. It's a woven diaphragm driver, so the upper breakup seems to be defined almost exclusively by the properties of the diaphragm totally isolated from the surround, or so it appears.
Dave
john k... said:when you move the mouse over one of the CSD plots the Clean Driver CSD plot will appear.
This doesn't seem to work in any of the browsers i have handy (iCab, Safari, Camino or FireFox)
dave
planet10 said:
This doesn't seem to work in any of the browsers i have handy (iCab, Safari, Camino or FireFox)
dave
Works fine for me in Firefox 2 (on XP). Have you got Javascript turned off? (JavaScript OnMouseOver is the browser event involved).
planet10 said:
This doesn't seem to work in any of the browsers i have handy (iCab, Safari, Camino or FireFox)
dave
Also make sure you allow the page to fully load. It won't work unless all the images are loaded. It can take a second or two for the change to take affect as well.
John K,
I use mortite for gaskets when I mount drivers and to damp horns- seems to sound better - I was wondering if you just placed tiny dabs on the cone or you put any thought to it beyond that? Sure looks prettier then stock or 'enable' - How big were the dots? Maybe small dabs of silicon glue would be similar but permanent. I can see a drum roll coming on and little dots of mortite being propelled at me
I use mortite for gaskets when I mount drivers and to damp horns- seems to sound better - I was wondering if you just placed tiny dabs on the cone or you put any thought to it beyond that? Sure looks prettier then stock or 'enable' - How big were the dots? Maybe small dabs of silicon glue would be similar but permanent. I can see a drum roll coming on and little dots of mortite being propelled at me
Have you got Javascript turned off? (JavaScript OnMouseOver is the browser event involved).
Also make sure you allow the page to fully load. It won't work unless all the images are loaded. It can take a second or two for the change to take affect as well.
Yes, yes, yes.
When i get back, i'll specifically try the 3 different vesrions of JavaScript available in my primamry browsers... (because there is no standard for javascript it is guaranteed to break somewhere)
dave
- Status
- Not open for further replies.
- Home
- Loudspeakers
- Multi-Way
- EnABL Processes