Maybe I just am not getting decent measurements as a result of a poor soundcard. In order to attempt to validate some things, I ran my DCX2496 with SPDIF input, and checked its output. It is a modified unit, whereby the DAC feeds directly into the Lundahl 1690 amorphous transformer. I was expecting very decent results as a result (ignoring noise floor, more concerned about harmonic distortion).
So I get the following capture, which although is better than my current D/A still looks worse than the site below shows:
http://esken.net/ergo/blog/wp-content/uploads/2008/01/1khz-thd-yelloworig-greenergos.png
Should I expect better performance than what I see?
So I get the following capture, which although is better than my current D/A still looks worse than the site below shows:
http://esken.net/ergo/blog/wp-content/uploads/2008/01/1khz-thd-yelloworig-greenergos.png
Should I expect better performance than what I see?
Attachments
Trying again. Sprung for Audiotester- cheap at $55.
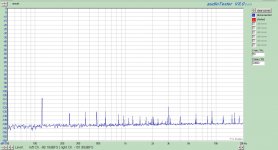
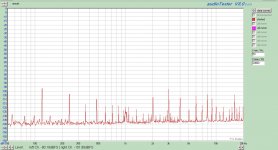
I am getting more suspicious of the soundcard. When I have no cable connected to its input, I get a noise floor that I was expecting (blue graph).
As soon as I connect a 1/4" plug to the input, I get something I don't like (red graph). This even with the other end of the short cable shorted out (tip-ring-sleeve). What I don't understand is why I am getting significant quantities of 1 kHz harmonics, with the input shorted and generator off ? Both input channels do the same thing.
Attachments
Should I expect better performance than what I see?
In a word, yes. See if you can borrow another soundcard to check. The Audiotester software is a bargain- the functionality is sometimes suspect for speaker measurements, but for basic electrical measurements, it does a fine job, and can give you excellent resolution.
All right, now we have some progress. Used the cheap soundcard input on the laptop, and got a poor noise floor, around -96 dB, but it was very flat with no harmonic aberrations. So clearly there is something amuck with the Saffire.
Just purchased an M-Audio Profire 610 - should be here mid next week, and I'll report on the next test.
Just purchased an M-Audio Profire 610 - should be here mid next week, and I'll report on the next test.
Okay, happy to report some better results. M-Audio came today, nice little box. Audiotester crashes now, so I'll have to address that, but Arta seems to be working fine.
Four plots attached. First is the noise floor (assuming I am measuring things correctly). I like that - nice and low without all the garbage spikes.
Second plot is the loopback at 0dB. Good, maybe not great, but I later managed to improve things by running at -5dB and getting the 2nd at -105 and the 3rd almost into the noise floor. So that should help me troubleshoot my differential stage, which will add the 3rd.
Third plot is a capture of the output of my DCX2496 with spdif input, running at 0dB. This is taken DIRECTLY off the D/A differential output pins. Very pleased with that result - all but the 2nd below -120dB. Can't complain about that.
Fourth plot is with the DCX driving a 1:2 Lundahl 1690 transformer. Loaded or unloaded secondary didn't change values at all, which is promising. THD about doubled, and the harmonics are a little higher than I was hoping for, but at least I have a nice waterfall spectrum. Ultimately, I will be using bifilar Jensen transformers in this position anyway, but it's good to see what the transformer does.
I really feel like I'm getting some meaningful measurements now with the new sound card. My reference sine wave may need a little experimentation, but at least the noise and power supply ripple is all but gone.
Comments and suggestions are welcome.
Attachments
How many bins in your 16-average FFT of the noise floor? Looking at the plot its impossible to get an audio-band related estimate of the SNR without knowing this important detail ") To see how good your trafo really is, have a look at what it does with a 20Hz test signal, rather than 1kHz.
To see how good your trafo really is, have a look at what it does with a 20Hz test signal, rather than 1kHz.
To see how good your trafo really is, have a look at what it does with a 20Hz test signal, rather than 1kHz.This is my first time doing this type of FFT testing with a computer, so I don't know all the 'correct' settings to choose, or the nomenclature. I can say that averaging really didn't push the plot that much further down, just made the plot thinner. Are you looking for sample rate or number of data points? For the noise floor and loopback (going by memory now, would have to repeat the measurement to be sure) it was 96 kHz with 64K size. It took maybe a second or two to update with averages turned off.
Everything with the DCX was done at 48 kHz, which is the max it will take without mods.
Yes, the transformer did look worse at the low frequencies, and placing a 4.7u cap in series (in case I had any microamps of DC) made the problem worse. By the specs, the Jensen is supposed to handle high levels of low freq with low distortion, so that will be a fun test to perform.
It is my understanding that a little distortion (I think I had 0.15%) at 20 Hz is benign and undetectable to the ear, whereas heading into the low midrange it becomes more audible? Regardless, the issue is not "can I hear it", but "can I measure it". I feel warm and fuzzy inside knowing I can actually measure and quantify something that I can't see with my eyes on a scope.
Are you looking for sample rate or number of data points? For the noise floor and loopback (going by memory now, would have to repeat the measurement to be sure) it was 96 kHz with 64K size.
Both are important but FFT size is the more interesting as I can estimate the sample rate fairly accurately from where the plot stops. Also as Scott pointed out earlier on, its important to know the effective bandwidth of the windowing function you used. Was it BH4 as you used earlier?
It is my understanding that a little distortion (I think I had 0.15%) at 20 Hz is benign and undetectable to the ear, whereas heading into the low midrange it becomes more audible?
Transformer distortion is fairly benign anyway. I recommend reading Bill Whitlock's white paper available at the Jensen website. 20Hz distortion from loudspeakers will be at least an order of magnitude higher.
Regardless, the issue is not "can I hear it", but "can I measure it". I feel warm and fuzzy inside knowing I can actually measure and quantify something that I can't see with my eyes on a scope.
yep, very satisfying indeed in a geeky kind of way.Here's the paper in case you hadn't seen it, very enlightening and I'm only half-way through it myself :
http://www.jensen-transformers.com/an/Audio%20Transformers%20Chapter.pdf
His electronics designs do need updating I must admit, looks like over 10 year-old designs. LM6325 went on last-time buy in 1998
<edit> having said (somewhat over-confidently) what I said above, why does the noise-floor plot stop just above 20kHz if the sample rate is really 96k?
Last edited:
I perused the ARTA manual and it says that the figure down at bottom left in red is the averaged level over the whole band (its -94.7dBFS in your case). That's the audio bandwidth noise floor calculated by summing all the FFT bin contributions. So its looking like you've got just slightly better than 16bit dynamic range - I'd expect a correctly dithered 16bit converter to give -93dBFS. The figure doesn't change when you go from 1 to 4 averages.
<edit> having said (somewhat over-confidently) what I said above, why does the noise-floor plot stop just above 20kHz if the sample rate is really 96k?
I tried it out last night and had some problem with ASIO drivers and an external USB device, otherwise this looks good at the price. BTW I would assume the good doctor has done all the math to get the noise/bin right since he offers a true power spectral density readout. I wish he just took paypal.
- Status
- This old topic is closed. If you want to reopen this topic, contact a moderator using the "Report Post" button.
- Home
- Amplifiers
- Tubes / Valves
- D/A preamp FFT measurements for review plz