Can one of you experts run a simulation for the 18LW2400?
I'm trying to figure out if this is a worthwhile design for my drivers.
Thanks
I all have them in my HR, but you need to point the design versions you want, there are different mods posted by Crescendo, XOc, EPA.
Below is your driver in the Epa 30hz mod (From #916 post)
grey = B&C 18SW100
Black = 18s 18LW2400

Last edited:
Other suitable drivers are the B&C 18SW115, B&C 18TBW100, Faital PRo 18HP1030 and the Oberton 18XB1600.
I must note that the limiting factor for the 18s driver is its 9,5mm xmax, to reach 30hz you can go to max 450w with HP 34hz 12db.
You can get more power out if it (550w) if you highpass at 40hz 12db/bw sacrificing a bit low end
I must note that the limiting factor for the 18s driver is its 9,5mm xmax, to reach 30hz you can go to max 450w with HP 34hz 12db.
You can get more power out if it (550w) if you highpass at 40hz 12db/bw sacrificing a bit low end
Last edited:
I all have them in my HR, but you need to point the design versions you want, there are different mods posted by Crescendo, XOc, EPA.
Below is your driver in the Epa 30hz mod (From #916 post)
grey = B&C 18SW100
Black = 18s 18LW2400
View attachment 656311
Thanks a lot USRFobiwan.
Do you have a plot showing max spl for the same 18LW2400?
This may sound silly, but I want to make sure I will get more SPL from 2 FT30s vs dual bass reflex (tuned to 30Hz)....
Thanks again
Last edited:
When looking at the x-max power rating don't forget the the power compression of the driver 2 or 3 db will make a big difference to the power needed to acheive x-max.
Of course x-max is not everything and there should be more power delivery than that for dynamic headroom.
Its always best to visually check excursion at war volume (Wear ear defenders!)
Of course x-max is not everything and there should be more power delivery than that for dynamic headroom.
Its always best to visually check excursion at war volume (Wear ear defenders!)
Here are some plots, first measurements ever. Out on pool deck, 30ft from house, sub pointed out over grass. Moved subs out of the way from one another when taking measurements to avoid interference. DBX mic 15-20ft from sub on the ground. Not calibrated for SPL at all.
I did a set of measurements with 27Hz LPF and 296Hz HPF and a set with 27Hz LPF and 80Hz HPF, with an additional plot with the LPF turned off.
Measurements were taken at a moderate volume.
I did a comparison between the two boxes to see what the difference was due to a slight build mistake on the first enclosure.
Yeah, my plots don’t look like this. Using REW and a dbx RTA-M, they have the dip and peak as seen in the sim. I’ve recently purchased a Cross Spectrum calibrated mic, so I’ll compare the two mics while measuring these subs, hopefully this coming week.
Are you using the 18SW115-8 or -4?
DATS Measurements
Measured each of my four 18SW115-8 loaded FT30 cabs the other day. Here are the results.
I'll upload frequency response measurements next.
Measured each of my four 18SW115-8 loaded FT30 cabs the other day. Here are the results.
I'll upload frequency response measurements next.
Attachments


REW Measurements Pt.1
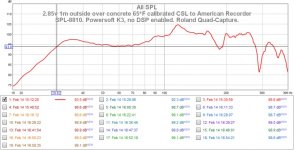
Here are the outdoor measurements at 2.85v (you'll just have to live with the extra 0.02v) at 1 meter, over concrete. 65*F, slight wind that day. Calibrated Dayton EMM-6 by Cross-Spectrum. No smoothing unless noted on the graph.
The next post will show 2.85v +12dB at 2 meters and some plots with four PEQ points. Same day, location, equipment, temperature & wind conditions.
Attachments
-
 TH2 greeen 2.85v 1m concrete driveway, bridged K3, DSP off, 65F CSL EMM-6 info.jpg98.8 KB · Views: 356
 -
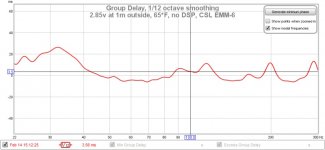 TH2 greeen group delay 2.85v 1m concrete driveway, bridged K3, DSP off, 65F CSL EMM-6.jpg56.9 KB · Views: 197
 -
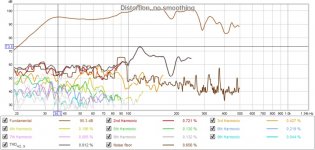 TH2 greeen distortion 2.85v 1m concrete driveway, bridged K3, DSP off, 65F CSL EMM-6.jpg98.2 KB · Views: 151
 -
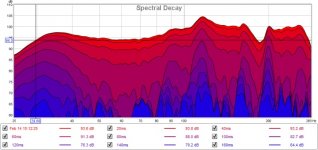 TH2 greeen decay 2.85v 1m concrete driveway, bridged K3, DSP off, 65F CSL EMM-6.jpg91.8 KB · Views: 145
 -
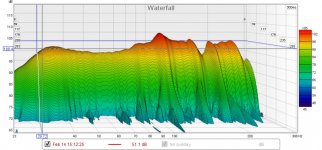 TH2 greeen waterfall 2.85v 1m concrete driveway, bridged K3, DSP off, 65F CSL EMM-6.jpg121.8 KB · Views: 115
 -
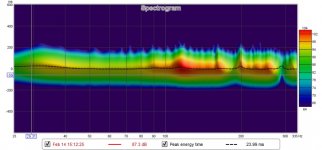 TH2 greeen spectogram 2.85v 1m concrete driveway, bridged K3, DSP off, 65F CSL EMM-6.jpg67.7 KB · Views: 115
Last edited:
REW Measurements Pt.2
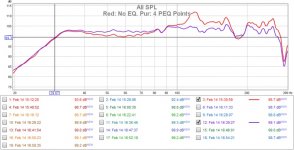
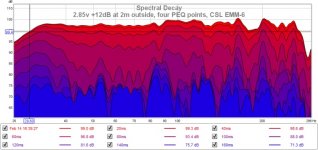
The following are still 2.85v +12dB at 2 meters. You'll find a plot comparing raw vs four PEQ points, then all the measurements for the sweep with the four EQ points. No smoothing unless noted on the graph.
The PEQs used in this test were within the Powersoft K3 DSP+AESOP:
57Hz, +2, Q2.
119Hz, -7dB, Q5
163Hz, -3.5dB, Q3.5
258Hz, -4dB, Q3
I didn't have enough time that day too do much more without getting hammered by mosquitoes. Next I'll have a play with crossover points and try to get some accurate phase measurements. Thought, the crossover points we currently use are HPF 24/25Hz BW24 & LPF 70Hz (w/o EQ) and up to 115dB w/EQ.
Any suggestions? Questions? Measurement requests? Inspiring messages?
Attachments
-
 TH2 green 2.85v +12dB 2m concrete driveway, bridged K3, no EQ vs four PEQ, 65F CSL EMM-6.jpg93.8 KB · Views: 150
 -
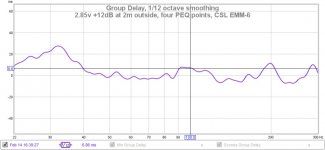 TH2 green group delay 2.85v +12dB 2m, four PEQ points, concrete driveway, bridged K3, 65F CSL EM.jpg53.5 KB · Views: 147
 -
 TH2 green decay 2.85v +12dB 2m, four PEQ points, concrete driveway, bridged K3, 65F CSL EMM-6.jpg101.4 KB · Views: 89
 -
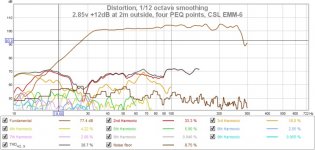 TH2 green distortion 2.85v +12dB 2m, four PEQ points, concrete driveway, bridged K3, 65F CSL EMM.jpg93.9 KB · Views: 101
 -
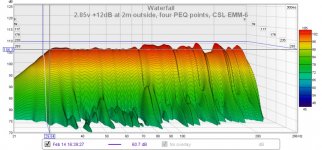 TH2 green waterfall 2.85v +12dB 2m, four PEQ points, concrete driveway, bridged K3, 65F CSL EMM-.jpg127.7 KB · Views: 95
 -
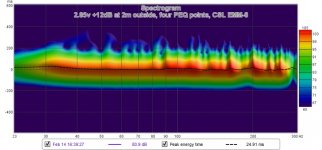 TH2 green spectogram 2.85v +12dB 2m, four PEQ points, concrete driveway, bridged K3, 65F CSL EMM.jpg74.9 KB · Views: 78
 -
 FT30 driveway testing 65F CSL EMM-6.jpg980.3 KB · Views: 122
Last edited:
Any suggestions? Questions? Measurement requests? Inspiring messages?
That is some very nice work there! It's great to see DIY work backed up by actual measurements.
Concerning the distortion curve, what's the distortion look like @40 Hz? That's in the passband and according to the impedance curve, likely the point where the driver is undergoing maximum displacement.
How does the response compare to the sim? You can check this by exporting the response from Hornresp as an FRD file, then importing it into REW. I'm particularly interested in seeing if the "lossy Le" feature in Hornresp produces a result that's a better match for the measurements.
Were the cabs close together for the impedance measurements?
- Home
- Loudspeakers
- Subwoofers
- C/E/X PA Flat to 30 (FT30) PA TH Awesomeness