For a given circuit topology, a simulation tool is though good for incrementally comparing results. E.g. for answering questions like "what's happening with the THD @1KHz if I increase Cdom"?
True.
..... LTSPICE looks to me awfully optimistic.
If you think LTSpice is optimistic, try Multisim!
refusing to take simple steps to see if your sim is accurate is not too defensible
does the distortion in your sim change with much smaller max time step?
Well, yes they do; the minimum is reached for a max time step of 2^17-1 across the entire simulation period, see below. The numbers are still twice as large as in LTSPICE, while the spectrum aspect (that is, the ratio between various components) changed for the worse. Next step would be to repeat the whole thing with the models in our lab's libraries (they are, some of them, largely different in structure to those posted by Mr. Cordell) but I've already spent enough time on this topic (and got caught, as usual, in the crossfire).
Here they are. Are you satisfied now?
I have no idea how to read and understand your tables; in particular how's the THD vs. frequency colums (or are those amplitudes of spectral components)? Where are the phases? What is IHD? Just by comparing the values (which I'm not sure if it's correct) even your sim results seem to be significantly different to those in LTSPICE.
But whatever the errors are, I guess I made my point; to keep consistency across various simulation platforms, there's a significant gap to be covered (models, simulation parameters, etc...) and it is not safe to assume that the gap can be made nil, within reasonable efforts.
What I am really surprised of is the stuborness in promoting simulation results of the order of 0.00001%, while it is quite obvious that such results are not necessary reproductible in other environments (not to mention physically, on the bench). I am also surprised that in Mr. Cordell's (otherwise excellent) book, simulation is not used to AC analyze the loop gain - that's the type of analysis where simulators are shining.
Enough said...
Attachments
Last edited:
I have no idea how to read and understand your tables;
I'm not surprised.
in particular how's the THD vs. frequency colums (or are those amplitudes of spectral components)? Where are the phases? What is IHD? Just by comparing the values
THD = rms value of the first ten harmonics.
IHD = individual amplitudes of spectral components.
MC9 = MicroCap V9
(which I'm not sure if it's correct) even your sim results seem to be significantly different to those in LTSPICE.
Come on, don't whine about a % or so. Probably due to different settings and different implementations a FFT or applied windows or whatever (single/double precision?).
But whatever the errors are, I guess I made my point; to keep consistency across various simulation platforms, there's a significant gap to be covered (models, simulation parameters, etc...) and it is not safe to assume that the gap can be made nil, within reasonable efforts.
......
Enough said...
The only point you've made is that either you lack the experience to not get fooled by a simulator, or you are using a lousy simulator which is totally incapable of doing a decent job.
But let's not deviate from the main subject: whether simulators are useful for assessment of THD figures, or not (see post 3737).
I'm convinced they are useful and if someone don't know how to use such tool or is using a wrong or bad tool, proves nothing.
Bottom line: Only fools get fooled.
I'm not surprised.
<snip>
The only point you've made is that either you lack the experience to not get fooled by a simulator, or you are using a lousy simulator which is totally incapable of doing a decent job.
<snip>
Bottom line: Only fools get fooled.
.
I'm convinced they are useful and if someone don't know how to use such tool or is using a wrong or bad tool, proves nothing.
Bottom line: Only fools get fooled.
Insanity...
The only point you've made is that either you lack the experience to not get fooled by a simulator, or you are using a lousy simulator which is totally incapable of doing a decent job.
More nonsense from Edmond.
The only point there is to make is that ALL SPICE simulators are lousy in respect of THD measurement.
Last edited:
........simulation is not used to AC analyze the loop gain - that's the type of analysis where simulators are shining.
True!
Bob amp using factory models
Hi
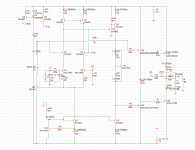
I have run the circuit in Cadence using factory models; I have included the models I’m using in a text file.
I had to change some resistor values and the Voffset, but otherwise the circuit is the same.
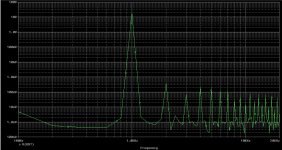
I have included the schematic, the schematic with currents, the 1k sinus spectrum, 20k sinus spectrum, AC open loop and AC closed loop in pdf files.
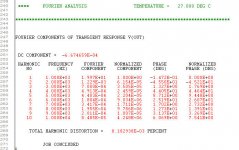
The THD for 1k and 20k are:
FOURIER COMPONENTS OF TRANSIENT RESPONSE V(OUT)
DC COMPONENT = 2.378319E-03
HARMONIC FREQUENCY FOURIER NORMALIZED PHASE NORMALIZED
NO (HZ) COMPONENT COMPONENT (DEG) PHASE (DEG)
1 1.000E+03 1.997E+01 1.000E+00 -1.469E-01 0.000E+00
2 2.000E+03 2.997E-03 1.501E-04 -8.440E+01 -8.411E+01
3 3.000E+03 2.317E-03 1.160E-04 4.826E+00 5.267E+00
4 4.000E+03 2.942E-04 1.473E-05 9.435E+01 9.494E+01
5 5.000E+03 1.876E-04 9.392E-06 1.786E+02 1.793E+02
6 6.000E+03 3.582E-05 1.794E-06 -1.140E+02 -1.131E+02
7 7.000E+03 1.234E-04 6.178E-06 3.760E+01 3.863E+01
8 8.000E+03 7.856E-06 3.934E-07 1.242E+01 1.359E+01
9 9.000E+03 5.802E-05 2.905E-06 7.271E+01 7.403E+01
10 1.000E+04 6.344E-06 3.177E-07 -6.707E+01 -6.560E+01
TOTAL HARMONIC DISTORTION = 1.906056E-02 PERCENT
FOURIER COMPONENTS OF TRANSIENT RESPONSE V(OUT)
DC COMPONENT = 9.555107E-02
HARMONIC FREQUENCY FOURIER NORMALIZED PHASE NORMALIZED
NO (HZ) COMPONENT COMPONENT (DEG) PHASE (DEG)
1 2.000E+04 1.991E+01 1.000E+00 -3.890E+00 0.000E+00
2 4.000E+04 1.196E-01 6.006E-03 6.116E+01 6.894E+01
3 6.000E+04 1.457E-01 7.315E-03 -1.249E+02 -1.132E+02
4 8.000E+04 3.744E-02 1.880E-03 1.725E+01 3.281E+01
5 1.000E+05 2.664E-02 1.338E-03 -1.750E+02 -1.556E+02
6 1.200E+05 9.825E-03 4.933E-04 -3.821E+01 -1.487E+01
7 1.400E+05 3.688E-03 1.852E-04 7.381E+01 1.010E+02
8 1.600E+05 6.614E-04 3.321E-05 1.794E+02 2.105E+02
9 1.800E+05 4.786E-03 2.403E-04 -3.845E+01 -3.443E+00
10 2.000E+05 3.167E-03 1.590E-04 6.474E+01 1.036E+02
TOTAL HARMONIC DISTORTION = 9.760467E-01 PERCENT
What am I doing wrong?
If this circuit is a ppm thing in LTspice, I will change to LTspice immediately (designing very low “ppb” circuits)
Cheers
Stein
Hi
I have run the circuit in Cadence using factory models; I have included the models I’m using in a text file.
I had to change some resistor values and the Voffset, but otherwise the circuit is the same.
I have included the schematic, the schematic with currents, the 1k sinus spectrum, 20k sinus spectrum, AC open loop and AC closed loop in pdf files.
The THD for 1k and 20k are:
FOURIER COMPONENTS OF TRANSIENT RESPONSE V(OUT)
DC COMPONENT = 2.378319E-03
HARMONIC FREQUENCY FOURIER NORMALIZED PHASE NORMALIZED
NO (HZ) COMPONENT COMPONENT (DEG) PHASE (DEG)
1 1.000E+03 1.997E+01 1.000E+00 -1.469E-01 0.000E+00
2 2.000E+03 2.997E-03 1.501E-04 -8.440E+01 -8.411E+01
3 3.000E+03 2.317E-03 1.160E-04 4.826E+00 5.267E+00
4 4.000E+03 2.942E-04 1.473E-05 9.435E+01 9.494E+01
5 5.000E+03 1.876E-04 9.392E-06 1.786E+02 1.793E+02
6 6.000E+03 3.582E-05 1.794E-06 -1.140E+02 -1.131E+02
7 7.000E+03 1.234E-04 6.178E-06 3.760E+01 3.863E+01
8 8.000E+03 7.856E-06 3.934E-07 1.242E+01 1.359E+01
9 9.000E+03 5.802E-05 2.905E-06 7.271E+01 7.403E+01
10 1.000E+04 6.344E-06 3.177E-07 -6.707E+01 -6.560E+01
TOTAL HARMONIC DISTORTION = 1.906056E-02 PERCENT
FOURIER COMPONENTS OF TRANSIENT RESPONSE V(OUT)
DC COMPONENT = 9.555107E-02
HARMONIC FREQUENCY FOURIER NORMALIZED PHASE NORMALIZED
NO (HZ) COMPONENT COMPONENT (DEG) PHASE (DEG)
1 2.000E+04 1.991E+01 1.000E+00 -3.890E+00 0.000E+00
2 4.000E+04 1.196E-01 6.006E-03 6.116E+01 6.894E+01
3 6.000E+04 1.457E-01 7.315E-03 -1.249E+02 -1.132E+02
4 8.000E+04 3.744E-02 1.880E-03 1.725E+01 3.281E+01
5 1.000E+05 2.664E-02 1.338E-03 -1.750E+02 -1.556E+02
6 1.200E+05 9.825E-03 4.933E-04 -3.821E+01 -1.487E+01
7 1.400E+05 3.688E-03 1.852E-04 7.381E+01 1.010E+02
8 1.600E+05 6.614E-04 3.321E-05 1.794E+02 2.105E+02
9 1.800E+05 4.786E-03 2.403E-04 -3.845E+01 -3.443E+00
10 2.000E+05 3.167E-03 1.590E-04 6.474E+01 1.036E+02
TOTAL HARMONIC DISTORTION = 9.760467E-01 PERCENT
What am I doing wrong?
If this circuit is a ppm thing in LTspice, I will change to LTspice immediately (designing very low “ppb” circuits)
Cheers
Stein
Attachments
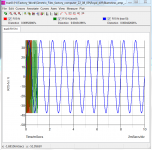
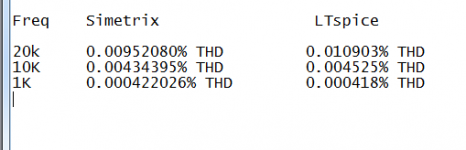
THD simulations using simetrix compared to LTspice
Here are the results I got comparing Simetrix with LTspice simulators
Here are the results I got comparing Simetrix with LTspice simulators
Attachments
Last edited:
....as Hans Camenzind. See:
http://www.designinganalogchips.com/_count/countdown.pl?designinganalogchips.pdf

Rodolfo
.... but I've already spent enough time on this topic (and got caught, as usual, in the crossfire)....Enough said...
Hey don't give up, thick your skin, charge ahead if convinced.
Will only do good for you even if proved wrong.
See, your first post on comparison Cadence - LtSpice spurred lots of interesting material.
Rodolfo
Indeed Waly,
You are the first to show data.
You stated how you obtained the data.
You stated your limitations.
You did everything right.
Now others and yourself, can expand on that knowledge and develop further the comparisons and alleged inaccuracies that Michael refused to justify.
You are the first to show data.
You stated how you obtained the data.
You stated your limitations.
You did everything right.
Now others and yourself, can expand on that knowledge and develop further the comparisons and alleged inaccuracies that Michael refused to justify.
Simulators
From the above results you can see that Simetrix and Ltspice in terms of THD simulation give similar results so it is fair to say Ltspice is good for THD simulations provided you have good models.
From my limited personal experience with Pspice I think its a little bit hard to drive when it comes to THD sims.
Simulators are given a bad rap by you Michael but as a tool for any electronic circuit design they are indispensable and good simulators are better than you think they are provided you have good models. You can explore audio amplifier performance very quickily and effectively before you build an amplifier.
From the above results you can see that Simetrix and Ltspice in terms of THD simulation give similar results so it is fair to say Ltspice is good for THD simulations provided you have good models.
For your Simetrix, the standard errors ref. LTSPICE are:
1KHz - 0.96%
10KHz - 4%
20KHz - 12.67%
Set aside the strange error vs. frequency distribution (intuitively, I would expect errors to be larger at lower frequencies, where THD is lower), I wouldn't call a 13% difference "similar results", but more like "in the same ballpark".
Can someone tell me if the spectrum peaks, for example the comparisons shown on post 3829, are the supposed to be the same as the individual .FOUR tabulated components (I dont think there is any power relationship I'm missing)?
I find it interesting that the spectrum peaks for the Orcad simulation appear to line up very well with the LTSPICE tabulated components (referring to post 3829).
I mention this because I thought that for the frequency plot Orcad did an FFT over the entire interval of the time data, whereas the .FOUR uses only the last cycle with some specialized way to calculate these components.
Thanks
-Antonio
up until you posted this reply you were doing very well. Let them argue about it.For your Simetrix, the standard errors ref.
Let yourself post more data.
Don't enter the argument. It demeans you. (I unfortunately fall into the same trap and speak/type when I should keep quiet).
Now instead of percentages, apply decibel ratios and think where those ratios lie with respect to 0dB (full test signal) and -120dB (1 ppm of the test signal).
Cadence
Hi Stein,
You are the second one who got erroneous results from Cadence.
Whether you are doing something wrong or you should blame Cadence, I don't know yet. Perhaps, you might ask syn08 (AFAIK he's also using the Cadence simulator) to repeat the sim and confirm your results.
If time allows, you also might sim the original and optimized 'blameless' amp, that is, with a LTP tail current of 6mA, LTP degen. Rs of 100 Ohms,
a decent current mirror and Cdom = 100pF. Now, THD @ 1kHz should around 10ppm. This value has been measured by D.S. himself.
>I will change to LTspice immediately
You have a far better alternative and it costs you nothing.
Cheers,
E.
Hi
[snip]
What am I doing wrong?
If this circuit is a ppm thing in LTspice, I will change to LTspice immediately (designing very low “ppb” circuits)
Cheers
Stein
Hi Stein,
You are the second one who got erroneous results from Cadence.
Whether you are doing something wrong or you should blame Cadence, I don't know yet. Perhaps, you might ask syn08 (AFAIK he's also using the Cadence simulator) to repeat the sim and confirm your results.
If time allows, you also might sim the original and optimized 'blameless' amp, that is, with a LTP tail current of 6mA, LTP degen. Rs of 100 Ohms,
a decent current mirror and Cdom = 100pF. Now, THD @ 1kHz should around 10ppm. This value has been measured by D.S. himself.
>I will change to LTspice immediately
You have a far better alternative and it costs you nothing.
Cheers,
E.
MicroCap vs LTspice
Admitted, the discrepancy between values of the 10th harmonic (MC vs LT) was a bit too large: 0.976ppm respectively 0.998ppm, i.e. a difference of 2.2%.
But that was due to the fact that I omitted the DC offset compensation at the input. With offset compensation included I got 1.005ppm. Now the discrepancy is only 0.7%. Not that bad I would think. Maybe you're still not satisfied, but for me it's good enough and we shouldn't whine about such minor issues.
........
Just by comparing the values (which I'm not sure if it's correct) even your sim results seem to be significantly different to those in LTSPICE.
........
Admitted, the discrepancy between values of the 10th harmonic (MC vs LT) was a bit too large: 0.976ppm respectively 0.998ppm, i.e. a difference of 2.2%.
But that was due to the fact that I omitted the DC offset compensation at the input. With offset compensation included I got 1.005ppm. Now the discrepancy is only 0.7%. Not that bad I would think. Maybe you're still not satisfied, but for me it's good enough and we shouldn't whine about such minor issues.
- Home
- Amplifiers
- Solid State
- Bob Cordell Interview: Error Correction