Maybe the issue was only settled in my head pages ago. I just looked at the evidence and stated what seemed obvious. Lynn (who is one of the people who helped me learn to measure a loudspeaker well) hasn't even acknowledge me, my posts, or their idea and evidence as a possibility until Gary went through and did a ton of work(still hasn't acknowledged me or my posts). If he/they had considered what I said and the evidence I presented, it would have saved them a lot of time and effort. And I was fairly thorough if you read through it! That's where these collaborations can be a good thing--people helping and listening to each other. Of course we should be weighting statements on the strength of the evidence presented instead of the conviction presented by the poster. That's where these things go wrong. If someone posts humbly and polite, they just get ignored. It seems you have to be inflammatory or outrageous to be heard these days. Blame it on the media. Way to go CNN and Fox(j/k, don't take offense people).
When you see a cone breaking up and it has a ton of output there in the timeframe of a ripple in the impulse, well I wouldn't think the problem was from an internal reflection or diffraction from the rear of the enclosure(Occam's Razor). It would also unlikely be from a first reflection creeping into the measurement in that region unless it was seen and more prominent in the midbass(which was very clean and Gary obviously did a great job). The directivity of the cone will just be too narrow at 1.5k for that to be an issue.
Soongsc, I have never seen a cone start breaking up elsewhere (other than the rim) first. IOW it was implied and obvious by looking at all the evidence on hand. Same goes for the impulse ripples. I've posted all this stuff before in a thread that you are participating in. Yes they can and will have resonances or hick-ups elsewhere, but full blown chaos? Seems to start at the rim and creep its way in--every time I've seen it measured. Now I'm sure someone's going to want to chime in with some unique case here, but why? We know what the problem is and we have several ways to minimize its impact on the end performance.
The internal damping material is also doing exactly as would be expected and you can see that in the response and the spectrogram. It just doesn't show so easily b/c either that speaker is great, the box is, or they both are(likely).
Hopefully that clears things up and we can move on.
Dan
Last edited:
The drivers I have on hand break up differently. I also went back and checked some Klippel examples of pro 15" driver. It does breakup like you say. Now it does seem interesting because I have never seen audio specific software simulation that predicts my driver breakup modes correctly, but rather they all end up with the rim flipping even though the correct material is applied.
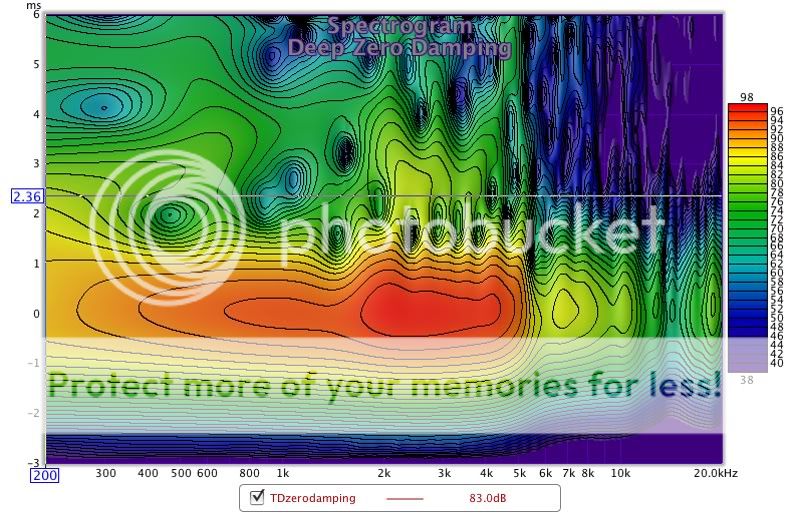
Looking at the wavelet analysis for the three cases of zero / less / full dampening we might draw some conclusions:
If thats any useful for you....
zero-damping:

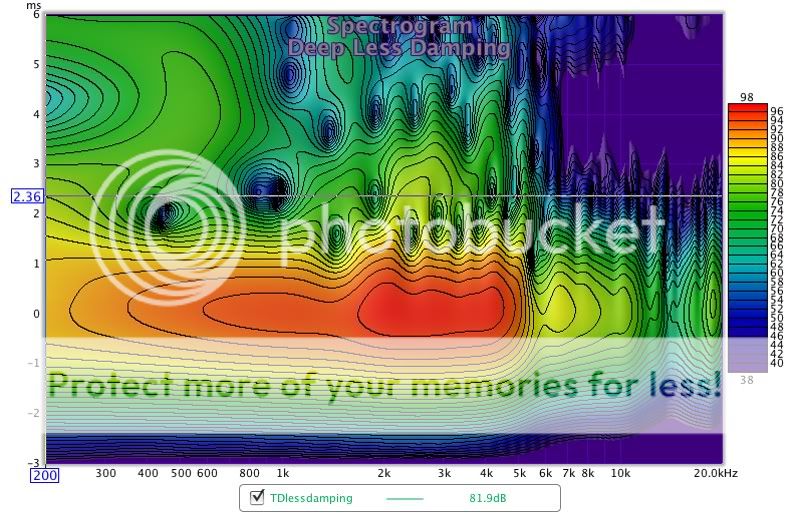
less-damping:

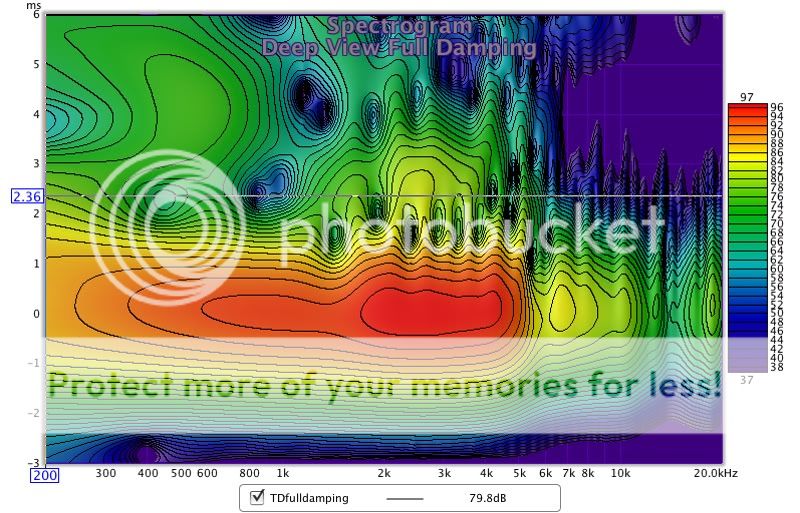
full-damping

There are mainly three regions I can identify – with pretty different sensitivity to damping measures:

The first area is the reflection cerntered around 2.3ms and at roughly 2kHz – this one interestingly does not much alter with differnt damping (same for the reflections - not marked - prior to that but slightly higher in frequency)
The second area are the multiple reflections coming along in the frequency range between 1kHz and 10kHz past 3ms
This whole area cleans up considerably with higher damping.
The third area is the one centered around 400Hz
This areas spreads out in time (!!) with increasing damping. It only gets very slightly lowered by heavy increase of damping.
Michael
If thats any useful for you....
zero-damping:
less-damping:
full-damping
There are mainly three regions I can identify – with pretty different sensitivity to damping measures:
The first area is the reflection cerntered around 2.3ms and at roughly 2kHz – this one interestingly does not much alter with differnt damping (same for the reflections - not marked - prior to that but slightly higher in frequency)
The second area are the multiple reflections coming along in the frequency range between 1kHz and 10kHz past 3ms
This whole area cleans up considerably with higher damping.
The third area is the one centered around 400Hz
This areas spreads out in time (!!) with increasing damping. It only gets very slightly lowered by heavy increase of damping.
Michael
Last edited:
I do not see any point in doing generic plots - simply as the frequency domain is the easiest to correct for - whereas there is no (electronic) treatment for reflections happening in the time domain.
Also we easily can 1:1 compare with any other driver solution this way - without getting bothered or mislead by different impulse shaping (occasionally or intended FR changes / corrections that is)
Basically - as said - a heavy lowpass filter for example will "clean up" anything in the upper departmant...
Do you have any special interest - why are you asking?
Michael
Last edited:
Maybe the issue was only settled in my head pages ago. I just looked at the evidence and stated what seemed obvious. Lynn (who is one of the people who helped me learn to measure a loudspeaker well) hasn't even acknowledge me, my posts, or their idea and evidence as a possibility until Gary went through and did a ton of work(still hasn't acknowledged me or my posts). If he/they had considered what I said and the evidence I presented, it would have saved them a lot of time and effort.
Dan
Sorry if I ruffled any feathers - as posted earlier, I was out of the loop, except for a series of phone calls from Gary as he went through all the possibilities.
I like to make as many measurements as possible, and to rule out even the most unlikely sources of coloration. At Audionics, Tektronix, and Nutshell, I've been bitten many times by obscure problems that were outside the published literature - measuring inter-driver phase angles and sources of diffraction come to mind for loudspeakers, amplifier-speaker current loops and the relationship between slew rate and phase margin for amplifiers.
There's an awful lot of stuff that hides in the shadows - hard to measure, but easy to hear. You have to devise your own measurements for most of this, working out measurement artifacts and trying to understand what the physical system is doing. This is the difference between models and the real world.
I'm glad Gary Dahl went to all the trouble he did; like writing, the only way to learn about loudspeaker design is to go ahead do it, and to measure every conceivable possibility, no matter how offbeat or unlikely. And he went ahead and did just that, with a little bit of telephone encouragement from me. I didn't catch up with all the postings here on diyAudio until several days later.
I must also confess I had unwittingly set a trap for myself by using the Ariel as a yardstick for impulse response - the electrostatic-like nature of its time response is not usually seen in the high-efficiency world of large-format drivers and horns. But no surprise there; these are little drivers in a speaker only 8" wide.
Attachments
Last edited:
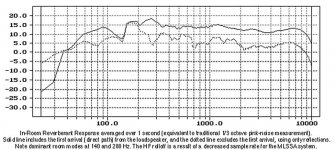
Good suggestion. Here's an example that compares the spectra of the direct arrival vs all of the indirect arrivals (room reflections). In other words, the lower curve has been windowed to exclude the first 2 milliseconds, but remain open for 1000 milliseconds afterwards.
Attachments
Last edited:
Good suggestion. Here's an example that compares the spectra of the direct arrival vs all of the indirect arrivals (room reflections). In other words, the lower curve has been windowed to exclude the first 2 milliseconds, but remain open for 1000 milliseconds afterwards.
I'd probably limit the window length to eliminate the room reflections as they really aren't the issue here. I.E maybe use a 5 msec long window for the full impulse and then a 2.5 long window when the first 2.5 msec is taken out.
No special interest per say. Just an interest. Don't mean to ask too much, but I can't do those and I like to see them. I always like to see the actual changes because normalization obscures changes too many relationships for me to make a clear assessment w/o seeing the info both ways. I prefer not normalized if I were to see one view. Then a normalized plot makes more sense to me.I do not see any point in doing generic plots - simply as the frequency domain is the easiest to correct for - whereas there is no (electronic) treatment for reflections happening in the time domain.
Also we easily can 1:1 compare with any other driver solution this way - without getting bothered or mislead by different impulse shaping (occasionally or intended FR changes / corrections that is)
Basically - as said - a heavy lowpass filter for example will "clean up" anything in the upper departmant...
Do you have any special interest - why are you asking?
Michael
Thanks again,
Dan
Titanium, I from much of the measurements I've gone through, it seems all metal cones are similar. For many of the speaker driver specific simulation programs, whenever I ask more detailed questions that will help me understand how accurate it will be, I never get answers. I don't want to go through that Loudsoft thing again, but it's good for educational purposes.Oh, Soongsc, what the profile of the cones that break up differently? Remember loudsoft?
Dan
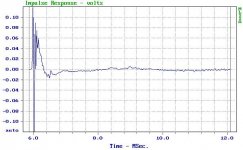
For those who have not followed the wavelet threads I might give a brief introduction on how to read the plots.
Actually, a wavelet plot does what John was just recommending - in a very detailed manner: looking at the frequency response at certain time slices.
So wavelet plots show the same as an IR plot but makes it easier to identify the frequency changings over time
To make clear what I'm saying we can compare the IR plot with the wavelet plot and then follow a vertical slot and then follow a horizontal slot;

Above we see the „meaning“ of wavelet analysis beeing a time-frequency analysis
Same scaling in the time domain for easy comparison.
Now lets look at some time slices of distinct different behaviour:

Above we see that at
1.)zero time
2.)around 2.3ms
3.)around 4ms
we have pretty different frequency response compared to each other
Remember – each vetical (time) slice is a valid „snapshot“ for the frequency behaviour at that exact time span we decide to look at.
Now lets look at how „a certain frequency“ behaves over time :

Above we see that - looking at a certain frequency of roughly 2kHz here – there is a severe „come and go“.
*If* Dan would do a measurements of a sine burst of 2kHz for example, then we would see this sine burst:
starting > possibly fading away > coming back more pronounced > possibly fading away again …..
In short: nothing we actually would like ! - by the way - same for the 400Hz region as mentioned earlier
Once gotten a little bit used to this analysis its pretty revealing to judge sonic patterns of speakers IMO. We have to keep in mind that sonic patterns are NOT only established in the frequency domain but even more so in the time domain.
Michael
Actually, a wavelet plot does what John was just recommending - in a very detailed manner: looking at the frequency response at certain time slices.
So wavelet plots show the same as an IR plot but makes it easier to identify the frequency changings over time
To make clear what I'm saying we can compare the IR plot with the wavelet plot and then follow a vertical slot and then follow a horizontal slot;
Above we see the „meaning“ of wavelet analysis beeing a time-frequency analysis
Same scaling in the time domain for easy comparison.
Now lets look at some time slices of distinct different behaviour:
Above we see that at
1.)zero time
2.)around 2.3ms
3.)around 4ms
we have pretty different frequency response compared to each other
Remember – each vetical (time) slice is a valid „snapshot“ for the frequency behaviour at that exact time span we decide to look at.
Now lets look at how „a certain frequency“ behaves over time :
Above we see that - looking at a certain frequency of roughly 2kHz here – there is a severe „come and go“.
*If* Dan would do a measurements of a sine burst of 2kHz for example, then we would see this sine burst:
starting > possibly fading away > coming back more pronounced > possibly fading away again …..
In short: nothing we actually would like ! - by the way - same for the 400Hz region as mentioned earlier
Once gotten a little bit used to this analysis its pretty revealing to judge sonic patterns of speakers IMO. We have to keep in mind that sonic patterns are NOT only established in the frequency domain but even more so in the time domain.
Michael
Last edited:


- Home
- Loudspeakers
- Multi-Way
- Beyond the Ariel