can't remember if Dave mentioned the frequency yet.
Simple theorectical calculation for optimum BSC would have the XO 190-270 Hz.
dave

I've not seen any of them first hand but judging by the photo's on Oak-audio the new 7p and 12pw's look distinctly bluer than the 10P's.. But it could simply be a matter of different white balance!
Likely. Side by side, from the 1st proto A6p thru the A6.2p, A12p, A10p A7p, and A12pw are all the same (at least before they are treated, my marroon/rose A6.2PeN are lovely).
dave
View attachment simple-2way-A7pA12pw.pdf
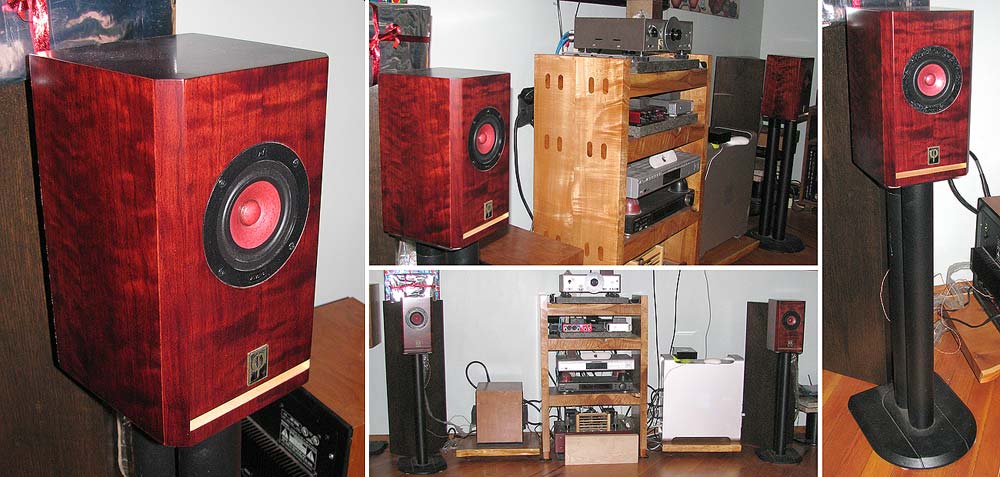
is that someone finally built this cabinet ? What do you think of the result ?
I'd like to see some pictures.
I'd like to see some pictures.
Likely. Side by side, from the 1st proto A6p thru the A6.2p, A12p, A10p A7p, and A12pw are all the same (at least before they are treated, my marroon/rose A6.2PeN are lovely).
Very pretty.
")
View attachment 449942 is that someone finally built this cabinet ? What do you think of the result ?
I'd like to see some pictures.
wish I was allowed to build something that simple
ours will be a dual TL MTM - pretty damned tight squeeze - some of the joinery has given me renewed respect for dental surgeons. I almost never slow down enough to take build pictures, but maybe Dave wants to release the preliminary concept sketch phantom model - just make sure to include the brace in the drawing.
Last edited:
Alpair 12PW measured parameters
Has anyone already measured the parameters of their 12PW's? I did so yesterday, and I found a resonance frequency of 41 Hz for one driver, and 40.6 Hz for the other one. Qts was 0.66 for both drivers. Now the resonance frequency doesn't bother me at all, with the drivers being new, but the measured Qts is high compared to spec (0.393 according to the datasheet), and this has implications for the alignment.
Do others see a similar deviation, or do I need to go back to the drawing board and check my setup? I am using LIMP with a 120 Ohms reference resistor. The setup measures various resistors accurately. The impedance plots look clean and credible, including the "kink" around about 500 Hz.
Attachments

Last edited:
Has anyone already measured the parameters of their 12PW's? I did so yesterday, and I found a resonance frequency of 41 Hz for one driver, and 40.6 Hz for the other one. Qts was 0.66 for both drivers. Now the resonance frequency doesn't bother me at all, with the drivers being new, but the measured Qts is high compared to spec (0.393 according to the datasheet), and this has implications for the alignment.
Do others see a similar deviation, or do I need to go back to the drawing board and check my setup? I am using LIMP with a 120 Ohms reference resistor. The setup measures various resistors accurately. The impedance plots look clean and credible, including the "kink" around about 500 Hz.
Hi Timpert,
Back to the measurement drawing board for your testing. There's no-way to maintain a F zero @ 41Hz on driver of this size with such a high total Q. I'm a good driver designer, but not that good.
Mark.
Last edited:
There no-way to maintain a F zero 41Hz on driver of this size with such a high total Q
That was also my gut feeling. The problem is: I have checked everything that you can check with my setup, and when hooking up different resistors (and a capacitor), the reported impedances in LIMP all came out right. Even the Rdc estimate was spot-on at 5.4 Ohms (measured and in the datasheet). So that's why I am very curious for other people's results.
We've been around this flagpole a few times in the past. Home measurements are unlikely to reproduce the manufacture's numbers for a variety of reasons, the most notable being that you measured at the mV level and Mark measured at 2.83V. The only reason I measure MA drivers is to assure that they were not damaged in shipment. Your IMP plot says that they are good. Go with Mark's numbers.
Bob
Bob
I can achieve about 1V across the driver with my current setup, and a small modification will allow me to measure at a higher level than that. I will do that when time allows. It may make a difference, but I doubt that tripling the drive voltage will cause the estimated Qts to assume the datasheet value.
Going with the datasheet values is my fallback scenario in case I absolutely can't get the measurement to the point where I have confidence in it. However, I am not willing to give up too easily. I simply want to know what is happening, and why I am getting the results I am getting.
Going with the datasheet values is my fallback scenario in case I absolutely can't get the measurement to the point where I have confidence in it. However, I am not willing to give up too easily. I simply want to know what is happening, and why I am getting the results I am getting.
Mark, do you use this thingie?
VIBOX - Voltage and Current Measurement Interface
If so, that would explain the difference in the results, because a series-R measurement is indeed quite different from a constant voltage measurement at low source impedance.
VIBOX - Voltage and Current Measurement Interface
If so, that would explain the difference in the results, because a series-R measurement is indeed quite different from a constant voltage measurement at low source impedance.
I can achieve about 1V across the driver with my current setup, and a small modification will allow me to measure at a higher level than that. I will do that when time allows. It may make a difference, but I doubt that tripling the drive voltage will cause the estimated Qts to assume the datasheet value.
Going with the datasheet values is my fallback scenario in case I absolutely can't get the measurement to the point where I have confidence in it. However, I am not willing to give up too easily. I simply want to know what is happening, and why I am getting the results I am getting.
You'll have to continue experimenting. Linear X V4 is a "gold standard" professional/industry system for T/S measurement, so you'll know when you've sorted out your measuring method when you get close to 0.39 total Q. Expect home based systems to have +/- 30% variance due to wider tolerances on voltage and output stabilisation. Also make sure you've given these drivers plenty of run-in time to allow the single mechanical suspension to acquire its operation service tolerance.
Thanks
Mark.
Last edited:
The only reason I measure MA drivers is to assure that they were not damaged in shipment.
+1
plus i use the measures for matching.
The 4 i have measured so far had Fs slightly lower than yours and Qt slighly higher. That was in the summer. If i measured them today the numbers would be different. I use S&L Woofer Tester 2 which comes with a current amplifier and measures at low levels (good software, lousy UI, and forces me to run Windows which is a 3rd rate OS).
We use factory numbers for design work.
dave
Expect home based systems to have +/- 30% variance
That's quite a sorry state of affairs, and puts them on the border line of usability. I have tried lowering the source resistance to 10 Ohms, it produces good looking plots, and the results with the test resistors are even slightly better than with 120 Ohms. Measured Qt has gone down to 0.58.
Funny thing is, the impedance measurements are all valid, and accurate within about 2% (estimated). The reason for the variance is purely the test subject being sensitive to the test environment. It seems that with LIMP, I will not be able to match the environment in which the Alpair's data has been obtained, so I have to look in another direction.
The match between my two drivers in terms of measured parameters is excellent, Q factors consistently turn out identical in my measurements, and the difference in resonance frequency is only 1%. I will stick with the factory data for the time being, but I'll keep on thinking on how to resolve my measurement issues.
Evan with our anechoic chamber that is air-conditioned and with pro-measurement gear, we expect a +/- 10% variance in results dependent upon air temp, pressure and humidity.
To get our T/S results , we typically test 10+ units pulled at random from the first production batch. We run them for 50 hours to get the suspension's warmed, then take the mean test data from the batch.
Thing to remember is your getting a close result to ours on F zero. That immediately tells you that your close to factory on a major measurement. Total Q is a representation of the compliance of the driver, so it should be relatively close to factory in order to achieve the same F zero.
For your situation, to get a total Q >0.6 equates to an low damping compliance on the driver, such that F zero would be something else from 41Hz. Exactly what the F zero would be in your test case if difficult to predict, as it depends on your test conditions.
Your situation highlights an age-old issue on Diyaudio, that too few members who home test properly understand the difficulties and complexities of testing. Some (too many in recent times) make the error of assuming home testing is "default" accurate. One only has to peak into a well set-up test science laboratory to realise the efforts and costs that have to be applied to gain reliable results.
All the same I'm glad your taking the time to investigate with an open mind. Its much appreciated.
Thanks
Mark.
Last edited:
- Home
- More Vendors...
- Planet 10 hifi
- Alpair 7P & Alpair 12PW combination.