Hello JoskaNZHi SapphireSloth. Sure no problem.
As per Leob's PA panels I diluted the hide glue 4 times as much as they recommend and the Shellac the same.
I don't really understand all that REW is showing me but happy if you can get some more info from it.
Thank you for sharing the file.
It is for me opportunity to check/improve to my own measurement technique.
Basically REW records a sweep, extract from that the impulse response (response over the time of the loudspeaker AND of the room) and them makes a time to frequency transform and shows several results.
Among the views, it is interesting to keep an eye on the IR (impulse response).
On this one, we see the so call "long tail" IR of a DML (the low decay of the IR) and a strong reflection at 4ms which might come from the floor or the ceiling. Is the mic at 1m from the DML and DML and mic about 1m above the floor? Some absorbent on the floor might reduces it?
I also openend the IR windows by which the window which defines roughly the duration of the IR used in the time to frequency transformation. Here it is the values by default so the FR reflects what happens in the 500ms. That means the reflections are in the FR. The response you get is closed of the energy response or what you obtain sending a permanent pink noise in the loudspeaker and measuring with a RTA.
In the second record, the reflections seem different. Are they surface closer to this panel than the first one? It could also explain some differences in the FR
Your post arrived just at the time I am considering in discussions with Steve the role of the room in recordings or measurement of panels.
There are 2 (at least) interesting information in REW about the conditions of the measurements defined by the room.
You can go in the RT60 and clarity folders. All is summarized in the RT60 folder is you check the "show data panel" box in the controls
First information is the Topt which as far as I understand that the reverberation time. The time for the energy to decay in the room.
Second information is the clarity C50 which is the ratio of the energy in the first 50ms to what happens after.
In comparison, what I just got in my rooms is a reverberation time of about 0.5s and a C50 at 1m in mean value from 250 to 4000Hz of 12dB.
I am curious to know more about the room you are... Which dimensions? furniture or treatment? distance of the panels to the walls? Don't read I could give some advises from that... It is more to build my own understanding.
@SapphireSloth : you seem to have not as smooth FR as Joska (as I have); what about the same characteristics in your room?
@Veleric, @Leob, @Andre Bellwood : as I think you are REW users, same question; What about the Topt, C50 in your measurements? It is my topic of the day!
So maybe last (sorry to be long), there is the possibility to have an idea of what happens in the early ms so to get an idea of the "on axis response" by :
setting the window end before the 1st reflection (quasi anechoic response)
This view in my opinion is a bit confusing because it lets think the FR is fully detailed above about 250Hz which is my understanding not true. The property of the FFT is to get information for each n/T, T being the duration of the window. So if the window is 4ms, you have information each 250Hz. I hope not being wrong on that! No magic to get rid off the reflections.
An other possibilities is to set a frequency dependent window (go in Tools/IR windows)
For those both, you can remove the 1/n oct smoothing as by nature, those operations smooth the FR. You see in the above box that window is set to 4 cycles (something I read recently used in an other forum which is closed of 1/6 of octave, the line below shows 1/5.5)
An other possibility, the one I prefer, is to make a wavelet spectrogram which gives the frequency and the time information
In the colorized graph, horizontal is the frequency, vertical the time. The color gives the level. Under is the a 2D slice at a given time, here 12µ (not possible to set at 0!)
I like this view because by its principle it is close of the filter bank which is in the ear (unfortunately not the brain treatment which is after). The vertical areas in the spectrogram show modes, either panel or room. The horizontal one, the reflections
The interesting property of the DML as a wide range loudspeaker, almost all the band is time aligned.
I stop here. This post is already too long! I just exposed here some possibilities of REW I use.
Christian
PS : I see I have forgotten the "controls" box of the spectrogram for easily getting the same view
Last edited:

Hi again JoskaHi SapphireSloth. Sure no problem.
As per Leob's PA panels I diluted the hide glue 4 times as much as they recommend and the Shellac the same.
I don't really understand all that REW is showing me but happy if you can get some more info from it.
The post from Sapphire let me to see I didn't have a look to the distortion folder. I don't go often in this view but I recently read it is a good view to have an idea of for example some unwanted resonances or let say some unexpected mechanical problems.
2 remarks :
- In the first and third record, you have a noise to FR difference of about 50dB at the best point (somewhere between 1 and 2kHz) which is also what I have in my measurements. in the second measurement, the noise floor is much higher as if something was recorded in addition of the sweep. It is an other possible explanation to the difference between the panel in addition to the coating
- In the "free panel" measurement, the distortion is much more important than in the other tests. What is the difference? Do you have after a spine (some frame to keep stop the exciter body moving)? Or might it be the effect of the panel weight on the voice coil in the "free" conditions causing a misalignment?
Christian
It's fun to slide the gating limiter on the Impulse tab to see how that unsmoothed FR graph changes with the slide. Ultimately you do need around 80ms to see what 100hz is really measuring, and the total smoothed FR with 80ms isn't usually too much different from the default 500ms, so I don't bother messing with it most of the time.
The room has a big impact on a lot of measurements and my room sucks. I'm taking the approach of having a baseline and comparing differences between tests from that baseline. I keep thinking about moving some tests outside but that's a lot of work and I can't do it for every test so I haven't tried yet. My neighborhood isn't that quiet either.
I wouldn't say that the FR I shared last is less 'smooth' than Joska's, but my FR slopes downwards more. Here's a different test I did recently in an overlay with Joska's, just because this one looks pretty decent and I have it handy:

This is 1/48 smoothing of both with Joska's in green and mine in red. My mic is ~7ft away from panel and the duct tape surround is awful. My driver also has some noise-generating problems and my room is completely untreated. My distortion readings are far higher, RT60 and Clarity also much worse. If I fix the room and panel surround and replace driver then those figures should be closer to Joska's, though his do look really good to me. Despite the current state of my setup we can still see a pretty good representation of FR. I still don't know what is causing that 75hz hole in my test though.
I don't usually do many off-axis tests because I run through so many iterations of testing that I don't have to time or bandwidth to take and analyze them all, but in the past I've seen that any off-axis problem I see with a DML will already be apparent on-axis as long as the mix is far enough away. If the mic is too close then when on-axis it is closer to the driver that measures more cleanly, but when off-axis the mic is closer to panel edges which are more dirty.
I am never going to listen to a DML 3ft (1m) from my head so I am much more interested in the 6 - 10 ft sound where the whole panel is heard more equally. Obviously I can't measure just the panel itself without the room interacting strongly at that distance so that's why I think "relative to baseline" and try to deduce the effects that changes to panels makes between tests using this data. There were a couple weeks where I did every measurements very close, like 3 inches from panels, and I got lots of great results but later when I moved far away I realized they weren't so great after all. Not because of the room, but because of the other parts of the panel that are not right around the driver where my mic was. Moving the mic to different near-field points on the panel and running tests can show wildly different results sometimes.
The room has a big impact on a lot of measurements and my room sucks. I'm taking the approach of having a baseline and comparing differences between tests from that baseline. I keep thinking about moving some tests outside but that's a lot of work and I can't do it for every test so I haven't tried yet. My neighborhood isn't that quiet either.
I wouldn't say that the FR I shared last is less 'smooth' than Joska's, but my FR slopes downwards more. Here's a different test I did recently in an overlay with Joska's, just because this one looks pretty decent and I have it handy:
This is 1/48 smoothing of both with Joska's in green and mine in red. My mic is ~7ft away from panel and the duct tape surround is awful. My driver also has some noise-generating problems and my room is completely untreated. My distortion readings are far higher, RT60 and Clarity also much worse. If I fix the room and panel surround and replace driver then those figures should be closer to Joska's, though his do look really good to me. Despite the current state of my setup we can still see a pretty good representation of FR. I still don't know what is causing that 75hz hole in my test though.
I don't usually do many off-axis tests because I run through so many iterations of testing that I don't have to time or bandwidth to take and analyze them all, but in the past I've seen that any off-axis problem I see with a DML will already be apparent on-axis as long as the mix is far enough away. If the mic is too close then when on-axis it is closer to the driver that measures more cleanly, but when off-axis the mic is closer to panel edges which are more dirty.
I am never going to listen to a DML 3ft (1m) from my head so I am much more interested in the 6 - 10 ft sound where the whole panel is heard more equally. Obviously I can't measure just the panel itself without the room interacting strongly at that distance so that's why I think "relative to baseline" and try to deduce the effects that changes to panels makes between tests using this data. There were a couple weeks where I did every measurements very close, like 3 inches from panels, and I got lots of great results but later when I moved far away I realized they weren't so great after all. Not because of the room, but because of the other parts of the panel that are not right around the driver where my mic was. Moving the mic to different near-field points on the panel and running tests can show wildly different results sometimes.
Thanks for looking and explaining Christian, I will have to re read your posts when I get the time this weekend but appreciate your time and explainations!Hello JoskaNZ
Thank you for sharing the file.
It is for me opportunity to check/improve to my own measurement technique.
Basically REW records a sweep, extract from that the impulse response (response over the time of the loudspeaker AND of the room) and them makes a time to frequency transform and shows several results.
Among the views, it is interesting to keep an eye on the IR (impulse response).
View attachment 1291300
On this one, we see the so call "long tail" IR of a DML (the low decay of the IR) and a strong reflection at 4ms which might come from the floor or the ceiling. Is the mic at 1m from the DML and DML and mic about 1m above the floor? Some absorbent on the floor might reduces it?
I also openend the IR windows by which the window which defines roughly the duration of the IR used in the time to frequency transformation. Here it is the values by default so the FR reflects what happens in the 500ms. That means the reflections are in the FR. The response you get is closed of the energy response or what you obtain sending a permanent pink noise in the loudspeaker and measuring with a RTA.
In the second record, the reflections seem different. Are they surface closer to this panel than the first one? It could also explain some differences in the FR
View attachment 1291292
Your post arrived just at the time I am considering in discussions with Steve the role of the room in recordings or measurement of panels.
There are 2 (at least) interesting information in REW about the conditions of the measurements defined by the room.
You can go in the RT60 and clarity folders. All is summarized in the RT60 folder is you check the "show data panel" box in the controls
View attachment 1291299
First information is the Topt which as far as I understand that the reverberation time. The time for the energy to decay in the room.
Second information is the clarity C50 which is the ratio of the energy in the first 50ms to what happens after.
In comparison, what I just got in my rooms is a reverberation time of about 0.5s and a C50 at 1m in mean value from 250 to 4000Hz of 12dB.
I am curious to know more about the room you are... Which dimensions? furniture or treatment? distance of the panels to the walls? Don't read I could give some advises from that... It is more to build my own understanding.
@SapphireSloth : you seem to have not as smooth FR as Joska (as I have); what about the same characteristics in your room?
@Veleric, @Leob, @Andre Bellwood : as I think you are REW users, same question; What about the Topt, C50 in your measurements? It is my topic of the day!
So maybe last (sorry to be long), there is the possibility to have an idea of what happens in the early ms so to get an idea of the "on axis response" by :
setting the window end before the 1st reflection (quasi anechoic response)
View attachment 1291301
View attachment 1291302
This view in my opinion is a bit confusing because it lets think the FR is fully detailed above about 250Hz which is my understanding not true. The property of the FFT is to get information for each n/T, T being the duration of the window. So if the window is 4ms, you have information each 250Hz. I hope not being wrong on that! No magic to get rid off the reflections.
An other possibilities is to set a frequency dependent window (go in Tools/IR windows)
View attachment 1291306
For those both, you can remove the 1/n oct smoothing as by nature, those operations smooth the FR. You see in the above box that window is set to 4 cycles (something I read recently used in an other forum which is closed of 1/6 of octave, the line below shows 1/5.5)
An other possibility, the one I prefer, is to make a wavelet spectrogram which gives the frequency and the time information
View attachment 1291310
In the colorized graph, horizontal is the frequency, vertical the time. The color gives the level. Under is the a 2D slice at a given time, here 12µ (not possible to set at 0!)
I like this view because by its principle it is close of the filter bank which is in the ear (unfortunately not the brain treatment which is after). The vertical areas in the spectrogram show modes, either panel or room. The horizontal one, the reflections
The interesting property of the DML as a wide range loudspeaker, almost all the band is time aligned.
I stop here. This post is already too long! I just exposed here some possibilities of REW I use.
Christian
PS : I see I have forgotten the "controls" box of the spectrogram for easily getting the same view
View attachment 1291319
Good point Christian. My room is untreated and quite small, but no door in the back and just a thick drape. I also have shelves and stuff in the back or the room and it is not really rectangular. For its size it is surprisingly good though, but to really evalulate the plates I prefer to make measurements outside. Not a good time for that in Sweden now though 🙁
I do my indoor measurements to evaluate panels at around 30cm distance, which is a bit close perhaps to get the complete picture, but reduces the effect of the room.
For actually tuning speakers for use in the room I instead use RTA and white noise and move mic around my typical listening position.
Here are my RT60 params for a plate I just built and is testing now:

Or the mdat if it is anything else you want to look at:
I do my indoor measurements to evaluate panels at around 30cm distance, which is a bit close perhaps to get the complete picture, but reduces the effect of the room.
For actually tuning speakers for use in the room I instead use RTA and white noise and move mic around my typical listening position.
Here are my RT60 params for a plate I just built and is testing now:
Or the mdat if it is anything else you want to look at:
Attachments
And for comparison here is the same plate but recorded at 1m (green) compared to recorded at 30 cm (red)

I suspect the dips around 200-250Hz for 1m measurement are room modes, but that the close measurement is a bit more jagged because it is picking up some modes more than others when miked so close.
Attached mdat for 1m measurement.
I suspect the dips around 200-250Hz for 1m measurement are room modes, but that the close measurement is a bit more jagged because it is picking up some modes more than others when miked so close.
Attached mdat for 1m measurement.
Attachments
Yeah the LF is where the close mic is the most deceiving, though in some cases I found the midrange to look much more controlled up close than it actually is at listening distances. I did so many tests last year with a close mic showing really nice response 80hz - 300hz and it took me a while to realize that for every one of those if I backed up a meter or 2 it looked a lot different. I usually look at 1/24 smoothing, while also checking 1/6 and none. I never took any panel outside for a test though one of these days I'll try it. I think the LF looking good up close and poor at a distance is likely caused by the panel bending so that the local pressure is highest by the driver and lowest at the edges, with the net total pressure (as measured at a distance) generally being lower or more volatile than desired.
One could argue that when measuring LF the timing window has to be so long that the room plays a huge role, however I found when testing different panels in the same position in the room some performed well where others performed poorly. I can't say this with certainty, but when we're looking at 5, 10, 15, 20 dB peaks and dips in the FR which do not go away from minor panel placement changes but do go away when the panel is switched to a different type, it seems pretty safe to say those peaky extremes are produced by the panel and not the room. Often when changing the dimensions of the panel the "problem areas" would shift up or down in frequency. This is why I'm pretty comfortable comparing panel tests that were measured at 2 meters.
One could argue that when measuring LF the timing window has to be so long that the room plays a huge role, however I found when testing different panels in the same position in the room some performed well where others performed poorly. I can't say this with certainty, but when we're looking at 5, 10, 15, 20 dB peaks and dips in the FR which do not go away from minor panel placement changes but do go away when the panel is switched to a different type, it seems pretty safe to say those peaky extremes are produced by the panel and not the room. Often when changing the dimensions of the panel the "problem areas" would shift up or down in frequency. This is why I'm pretty comfortable comparing panel tests that were measured at 2 meters.
@SapphireSloth
The room modes affect the LF most as well, so I don't think it so clear cut. What you can try is measuring close but at different positions and see how much it differs compared to measuring further away.
At least in my case, moving the mic at different locations 30cm away does not change the response as much as moving the mic further away. And I do know my room and have observed those dips in the low mid in many different measurements.
Ideal distance to use of course really depends on your room, mic and speaker positions. For me 30cm seems to be the best if I want to get a decent idea of the FR of the plate. If you are actually tuning the plates to the room, 30cm is too short, then you want the rooms effect to be as strong in the signal as your typical listening position, and then 2m might make sense depending or your room as well as speaker and listening positions. But for a measurement of the plate itself, unless you have a really large or well treated room, you would get way too much room information.
"Room information" I understand and believe, but for me the question is how much does it skew the panel's FR? 5dB? 10? 20? There's been lots of discussion in this thread about how DMLs are less affected by the room than cone speakers and after doings tons of different tests inside my room that idea seems to be true. Or maybe other speakers aren't affected as much as I thought. I don't have much experience measuring systems aside from these DML experiments and one set of older Definitive Technology tower speakers I've got.
One day I will haul my gear outside and test it to find out how much the room affects my measurements. Lots of rain in the forecast though.
One day I will haul my gear outside and test it to find out how much the room affects my measurements. Lots of rain in the forecast though.
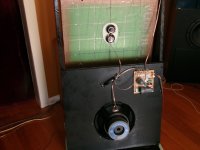
Hi there folks 🙂
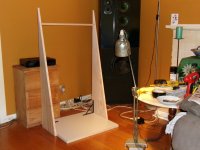
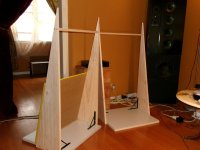
I have finally finished my HYBRID DML speaker project > DML + open-baffle woofer + tweeter.
I will start with the wood-work. ( I had to build with no workshop and only hand-held tools )
The first challenge was to not only make a frame to hang the panels, but also provide a quite large baffle
for the woofer + a mounting position for the tweeter.
Using some imagination, I arrived at a rather unusual & unique design.
My starting point was to provide a strong & sturdy floor base-plate > 620mm x 540mm x 25mm = 5.5Kg.
( because these speakers go strongly down to 30Hz, I didn't want them 'dancing about' )
From this base I built upwards > apart from this base-plate and a 'hanging brace', there are only 3 pieces of wood.
Here are some pictures:
Attachments
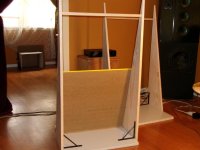
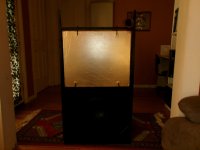
CONTINUATION ...
When I first made & hung the 600mm x 500mm DML panels and connected them directly to the amplifier >
I was dreadfully shocked by their horrible sound. They were 'honky & resonant' and tonally wrong.
I thought - boy have I got a challenge on my hands to make these sound good.
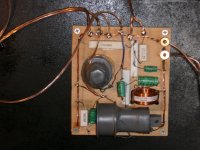
The first stage to improve sound and incorporate the woofer and tweeter was to design 'passive EQ' into
the crossover network. This improved sound by 50%.
When I first made & hung the 600mm x 500mm DML panels and connected them directly to the amplifier >
I was dreadfully shocked by their horrible sound. They were 'honky & resonant' and tonally wrong.
I thought - boy have I got a challenge on my hands to make these sound good.
The first stage to improve sound and incorporate the woofer and tweeter was to design 'passive EQ' into
the crossover network. This improved sound by 50%.
Attachments
CONTIUATION ...
The actual sound of the speakers is better than the 'frequency response plot' would indicate.
The front & back radiation creates a multitude of reflections that show up a 'combe filtering'.
I also have some reservations regarding my measurement microphone - it had a drop to a hard-wood floor.
I should state that these speakers are not efficient and need a good 100W per ch. amp for full dynamics.
There is one great thing about these speakers > you don't need to buy or build sub-woofers,
the bass response is really quite stunning 🙂
That looks pretty much like an open baffle sub you just built, why do you not consider that portion a sub?There is one great thing about these speakers > you don't need to buy or build sub-woofers,
the bass response is really quite stunning
with the measuring mic at anything more than about 3ft from the speaker the room response is going to swamp your speaker measurement.
Yes, contrary to boxed cone speakers, DML panels do seem to sound better than their FR's. Definition and separation of instruments does not seem to be influenced very much by the FR.CONTIUATION ...
The actual sound of the speakers is better than the 'frequency response plot' would indicate.
I fully understand your question & point ...That looks pretty much like an open baffle sub you just built, why do you not consider that portion a sub?
It is pretty much the use of terminology. Most (many) consider a sub. to be something in its own box.
Also, open baffle is not generally associated with subwoofers. (many say - open baffle all the way, except for sub.)
I like to think that I've just built an integrated speaker with great extended bass 🙂
Hello SapphireSlothUltimately you do need around 80ms to see what 100hz is really measuring, and the total smoothed FR with 80ms isn't usually too much different from the default 500ms, so I don't bother messing with it most of the time.
Yes it is what I mentioned by the 1/Window duration. 100Hz is 100ms period so need a window about that. I haven't yet compared a 80ms window to an other type of smoothing.
It is something I also observe with a daex25hfe on EPS even if the bandwidth is much better with a PVA glue exciter as Steve recommend than with the double side tape I used before.My FR slopes downwards more.
I have currently an EPS test panel. First is was just hung by tape at its top. Terrible how this small tape ribbon was noisy. Tape is no more in my tool box for DMLthe duct tape surround is awful.
Jozka's values are very far from what I have. it is why I asked for other values. The reverberation time in my rooms is about 0.5s. A bit less in the living room, A bit more in the kitchen. The C50 is 12dB in the living room at 1m (first value, it is a "fresh" topic) and only 8dB at 0.8m in the kitchen which is more reverberant.RT60 and Clarity also much worse.
A good additional test, we have example from Veleric, is to check the impedance curve. The peaks show the panel resonance. The first mode might be below and the next higher. An other possibility is a room effect.I still don't know what is causing that 75hz hole in my test though.
Same problem here. We can generate quickly more test cases than we can analyze.I don't have to time or bandwidth to take and analyze them all
Close mic in DML can give information about what happen locally. Eric shown interesting things with that. Each area of the panel has its own behavior, acting like a small loudspeaker so some observation distance is needed to get the whole picture. In measurement of classical loudspeaker, there is a rule of thumb saying the measurement distance has to be 3 times the largest dimension of the system (ie the cabinet diagonal)... which leads to the mix with the room... and what you do to go by comparison. No magic!There were a couple weeks where I did every measurements very close, like 3 inches from panels, and I got lots of great results but later when I moved far away I realized they weren't so great after all. Not because of the room, but because of the other parts of the panel that are not right around the driver where my mic was. Moving the mic to different near-field points on the panel and running tests can show wildly different results sometimes.
Christian
Thank you for the feedback Leob.And for comparison here is the same plate but recorded at 1m (green) compared to recorded at 30 cm (red)
View attachment 1291495
I suspect the dips around 200-250Hz for 1m measurement are room modes, but that the close measurement is a bit more jagged because it is picking up some modes more than others when miked so close.
Attached mdat for 1m measurement.
Your room seems also less reverberant than mine and in consequence I guess, the clarity is higher.
Our environment (home) is like it is but it is interesting to have an idea of how reverberant it is, including the place we make measurements.
Just to come on the "methodology" aspect which was mainly the topic in my previous post, The distortion folder of your measurements shows a good noise floor and a peak of distortion at 4,2k which matches with a peak in the FR. Something happens here...
Most of the time, I don't have this look to the distortion for my own measurements!
So I just opened files of a panel I am playing with at the moment to see the distortion curves are awful compare to yours...
In a first one, when the panel was tape suspended, it was clearly audible. With a string suspension, it was improved. I had a doubt if it was fully fixed... I see it is probably not!
Lesson of that. REW is an excellent too. Go to the different views to collect all the information. If something looks weird, it is weird.
I have also done some outdoor measurements. Not easy to do. Need the right weather : even a little wind is a problem, for the mic, against the panel. No noise around.
Those days, I am testing different mics and preamp so I have a look to the noise floor. Even a bird singing outside, all the doors and windows closed changes the curve (not a lot, just to say all of that is very sensitive)
Christian
- Home
- Loudspeakers
- Full Range
- A Study of DMLs as a Full Range Speaker