total power will not change as it depends mainly on B+ and OPT primary impedance.
Cranking up the current will generally reduce distortion, improve the distribution of the harmonic spectra, and improve the damping factor. It generally does not increase power output. This is true in both SE and P-P amps. Once you have reached the point where all of your B+ is going into the OPT (clipping) the way to get more power involves a lower load impedance, or more B+. There is sometimes a little to be gained by using an output tube that saturates at a lower plate voltage (less power lost in the tube).
I thought your OPT's were only rated for 25 watts.
Thanks for the clarification! Just doing a 'gross error check' to see if I had screwed up somewhere ")
Yeah, the output transformers are rated for 30 watts. I guess that the Tamuras were a little too expensive to "turn it up till it explodes - then back up just a little"
Given the results above, what would be the ideal idle current? I am assuming about 70% of rated power for tube life? That would be about 32mA for a regular 6L6 (18.5W dissipation) and 52mA for a 6L6GC (30W dissipation)?
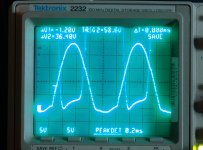
I have not tried to measure distortion yet, other than look at scope output. For setting the current sinks on the diff amps, I looked at the input from the function generator on one channel, and the output of the driver stage on the other channel of my analogue scope and adjusted the trace so the output was superimposed on the input. Adjusted till the traces were the same. I recently purchased for just a few dollars an old HP 331A distortion meter, so I might be able to do some measurements. Problem is my function generator and signal generator don't measure particularly well, and I am not set up yet for PC based measurements. My new cheap digital scope has been useful for voltage and frequency measurements though.
For frequency response, I am assuming that the -3dB point is when output voltage reduced by half? If so, with 204mV input, the output was 12V pp (about 2 watts RMS output) from 1kHz up to 7kHz, reducing to 11.3V at 20kHz, with 6V output (-3dB?) at 91kHz. Low end was only down to 11.2V at 10hZ. Does that look reasonable?
Square wave response dead square at 1kHz.
Time to drill holes for the second chassis I think!
Yeah, the output transformers are rated for 30 watts. I guess that the Tamuras were a little too expensive to "turn it up till it explodes - then back up just a little"
Given the results above, what would be the ideal idle current? I am assuming about 70% of rated power for tube life? That would be about 32mA for a regular 6L6 (18.5W dissipation) and 52mA for a 6L6GC (30W dissipation)?
I have not tried to measure distortion yet, other than look at scope output. For setting the current sinks on the diff amps, I looked at the input from the function generator on one channel, and the output of the driver stage on the other channel of my analogue scope and adjusted the trace so the output was superimposed on the input. Adjusted till the traces were the same. I recently purchased for just a few dollars an old HP 331A distortion meter, so I might be able to do some measurements. Problem is my function generator and signal generator don't measure particularly well, and I am not set up yet for PC based measurements. My new cheap digital scope has been useful for voltage and frequency measurements though.
For frequency response, I am assuming that the -3dB point is when output voltage reduced by half? If so, with 204mV input, the output was 12V pp (about 2 watts RMS output) from 1kHz up to 7kHz, reducing to 11.3V at 20kHz, with 6V output (-3dB?) at 91kHz. Low end was only down to 11.2V at 10hZ. Does that look reasonable?
Square wave response dead square at 1kHz.
Time to drill holes for the second chassis I think!
3dB point is when output voltage reduced by half?
3db point is when output voltage is .707 X starting voltage.
Most function generators have pretty high distortion. You should be able to find a "test CD" cheaply or even downloadable. You need some clean tones at various frequencies. These are as good as or better than a high end audio oacillator. You can then measure distortion and frequency response with your 331A.
Doh! Thanks guys! At least with the cheap Rigol digital scope it is easy to perform such measurements. Tour de France has me inspired, and it is a nice day outside, so out to ride my bicycle. Experiments and further building later in the day! Regarding the freq response, what power level should I measure it at to be meaningful? Also, what measurements of the driver stage would be useful, as it is Tubelab's 'universal driver' design and is probably of interest to some.
Once again, thanks Tubelab and SpreadSpectrum. Your help has been invaluable in getting this thing completed and teaching me! Hope to have the second monoblock completed in a week or so!
Cheers,
Chris
Once again, thanks Tubelab and SpreadSpectrum. Your help has been invaluable in getting this thing completed and teaching me! Hope to have the second monoblock completed in a week or so!
Cheers,
Chris
Last edited:
Tour de France has me inspired, and it is a nice day outside, so out to ride my bicycle.
Have a great ride, and watch out for the cars.
Are we the only ones watching the Tour.
Jeff
...Problem is my function generator and signal generator don't measure particularly well, and I am not set up yet for PC based measurements. .
Got an iPod or a CD player. Almost any music software like Garage Band or Logic can create a sine wave. You put the test tones on the iPod and now you have test waves with near zero THD.
I was lucky and just bought for $25 an old Heathkit 1953 vintage audio signal generator. It does sine waves at better than 1% using a wein bridge oscilator Looking inside a previous owner had modified it for better performance. I got the old manual and his hand written calculations for the mods. I think Heath copied an older HP design. Six tubes inside
That said an old Sony walkman might work better. Just google for "test tone".. Lots of free tones you can download
Thanks for the suggestions.
Using the HP331A to measure the distortion of my signal sources, I get:
Function generator: 0.64%
audio output of netbook PC using Audiotest software: 0.33%
pocket audio oscillator (kit based on design by Rod Elliot of Ellioit Sound Products): 0.12%
Have not measured output of iPhone (iPod) with a test tone, it may be useful. Can I use a formula like:
distortion of source * 'X' = distortion of output
(or) distortion of source + 'X' = distortion of output
and solve for 'X' where 'X' is the distortion of the device under test?
Sorry for the dumb questions, but I would like to be able to give some meaningful results back to the forum after the amazing amount of effort that was given to assist me to build this.
Regards,
Chris
Chrish: As far as proper bias for the output tubes goes........it depends on the loadlines. Plotting (and re-plotting over & over again) is a great exercise.
For the sake of argument, with fixed dissipated power (say 24w for EL34), lowering B+ and raising Ia puts more of the total power in class A, and only the last bit of total power will be in class B. Raising B+ and lowering Ia will transition from class A to class B sooner as required output is increased.
For example for EL34 triode 350V@68ma=24W, 400V@60ma=24W, and 440V@54ma=24W.
The 350V/68ma example is deeper into class A than the 400V/60ma.
So you can also play with B+ and Ia to see what sounds best to you.
Here is a straightforward explanation of PP triode load lines:
loadmatch3-pp-triodes
Another excellent explanation of load lines/output power by Miles Prower in post #11 is here:
http://www.diyaudio.com/forums/tubes-valves/110963-ppp-opt-clarification.html#post1340175
http://www.diyaudio.com/forums/tubes-valves/110963-ppp-opt-clarification.html#post1340175
Keep in mind that the right (and much more difficult way) of plotting push-pull load lines is by forming composite characteristics. See Steve Bench's site for some examples of how to do this in excel. I actually painstakingly entered curves into excel pixel-by-pixel for the KT88 and plotted plate-to-grid feedback curves for 10% and 20% feedback, then formed composite curves at a few bias points. Took forever. It would be awesome if someone made software that could scan in curves and do this kind of stuff.
boywonder,
At some point earlier in this thread Tubelab presented some power measurements and I didn't understand how they could be possible (I was using the method outlined by Miles to calculate max power out) and it turns out that the answer is that this is a rough approximation, the only way to do this right is composite curves. Honestly, I think drawing a line straight from the bias point with the 'class b' load value to the saturation or grid current point seemed to give more accurate max power out estimations if that is what you are after.
Tubelab presented some power measurements and I didn't understand how they could be possible..... the only way to do this right is composite curves.....drawing a line straight from the bias point with the 'class b' load value to the saturation or grid current point seemed to give more accurate...
Don't forget that many of my circuits run right into positive grid current. That does not pose a distortion issue on most tubes if the driver is stout enough (mosfet). My circuits are developed with as many as 5 seperate lab type adjustable power supplies and multiple load impedances so that I can adjust and optimize everything. Often the published tube curves don't match the tubes that you have in your hand, and they may not be available at the screen voltage you are using.
You want to see some power numbers. How about 504 watts out of Petes magic red board! I can assure you that I make the measurements with a fat 8 ohm resistor that does have some inductance, but I have measured it and it is very close to 8 ohms at 1KHz. It is about 3% high at 20KHz. The power numbers come from an HP 8903 which matches a borrowed Fluke RMS reading voltmeter. Even if the numbers are all wrong, the heat coming off of that resistor was very real!
Hey guys, so glad I found this thread...
I've been thinking of doing pretty much exactly the same thing for a while now, but with 6N1P's as the two directly coupled differential stages, cap coupled to MOSFET followers directly coupled to the output tubes.
For output, I'm using the Russian 6P3S, a 6L6 equivalent. The stats are 47 Watts through a 3.8K OPT. With the anodes at 360V and screens at 270V.
I'm winding the trafo's myself, and I'd like to include 450V and 400V windings to have the option of running genuine 6L6GC's at max ratings through this amp at a later stage.
My question is, with the datasheet suggesting 6L6's with anodes at 450v, screens at 400v through a 6.6k OPT, what should I expect if I ran them at these voltages through the 3.8k OPTs? Just increased power and distortion or exploding tubes?
Also, I like George's idea of a variable DC bias on the grid of the right hand triode of the first stage, can anyone think of a way this could be combined with global feedback to this grid?
Thanks
My question is, with the datasheet suggesting 6L6's with anodes at 450v, screens at 400v through a 6.6k OPT, what should I expect if I ran them at these voltages through the 3.8k OPTs? Just increased power and distortion or exploding tubes?
Maybe both. My guess is that the 6L6 type would be on the edge of meltdown depending on how often you turn the volume up for long periods of time. Maybe stuffing some stout KT88 types in for these moments would be a good option.
Also, I like George's idea of a variable DC bias on the grid of the right hand triode of the first stage, can anyone think of a way this could be combined with global feedback to this grid?
Easy. See the attached schematic. It is an unfinished work based on succesful experiments. The input circuit was lifted directly from my 6L6GC driver board except for the pentodes. I need more gain to drive the really big stuff.
Attachments
Don't forget that many of my circuits run right into positive grid current. That does not pose a distortion issue on most tubes if the driver is stout enough (mosfet). My circuits are developed with as many as 5 seperate lab type adjustable power supplies and multiple load impedances so that I can adjust and optimize everything. Often the published tube curves don't match the tubes that you have in your hand, and they may not be available at the screen voltage you are using.
You want to see some power numbers. How about 504 watts out of Petes magic red board! I can assure you that I make the measurements with a fat 8 ohm resistor that does have some inductance, but I have measured it and it is very close to 8 ohms at 1KHz. It is about 3% high at 20KHz. The power numbers come from an HP 8903 which matches a borrowed Fluke RMS reading voltmeter. Even if the numbers are all wrong, the heat coming off of that resistor was very real!
I didn't forget, I've been there myself. The problem was that the only way to make your power measurements make sense with the calculation method cited above was with negative plate voltages on peaks!
There is nothing wrong with that method as long as you understand that it is an approximation and it under-estimates max power out. If you want to do it right, it is a serious undertaking.
The problem was that the only way to make your power measurements make sense with the calculation method cited above was with negative plate voltages on peaks!
Negative plate voltage? Like this? Negative plate voltage IS possible, but usually only happens in clipping into a reactive load.
Photo shows the drive voltage in screen drive and the plate voltage on a pair of 6CB5's being driven well into clipping at 130 watts. The scale is 50 volts per division. The screen swings from -25 to +240 volts and the plate goes from -5 to + 1100 volts. This photo shows the fatal flaw in cranking maximum power via screen drive. At the instant of peak power the plate is near zero, and the screen grid is at +240 volts. It glows like a light bulb. The screen is still glowing when the next half cycle comes and the screen is zero while the plate is 1100 volts. The screen begins to emit electrons, and BANG happens!
__________________
Attachments
Getting back to more sane levels of power (!!!), Chris, I did a loadline for 6P3S-E, the upper red line is Class A with 40mA bias current, the blue line is Class B, and an approximate way of calculating power underneath, from the valvewizard PP section, which closely matches the Pat Turner method in results, give a watt or two. The position of "point B" is fairly crucial, without mosfet source followers one is unlikely to reach zero grid volts without distortion, also, for Class AB2, you can see how point B could be located on positive grid curves and why the power then increases, more current and a larger anode voltage swing. But with the Class B loadline passing below the "knee" of the zero volt grid curve (in the posted loadline) we have already hit saturation with no more room to move. With a higher B+, there would be more room. I think this is what Tubelab meant when he said in post 462 "There is sometimes a little to be gained by using an output tube that saturates at a lower plate voltage (less power lost in the tube)." As to where the actual grid curves will lie with any particular valve, or different screen grid voltage, or UL connection, is anyone's guess. So the loadline is just a rough idea of what you might expect, or a guide on how to or how not to abuse the tube in question. To draw the loadlines I use a screenshot of the datasheet, paste it into MS Paint and draw lines over it. In your case, it looks like the 6P3S-E are conservatively loaded. I also realize you are only using them as "test tubes". Just my newby understanding of working out approx power with a loadline, may or may not help...hope it does help.
Ian.
Ian.
- Status
- This old topic is closed. If you want to reopen this topic, contact a moderator using the "Report Post" button.
- Home
- Amplifiers
- Tubes / Valves
- 6L6GC AB2 Amp