Tweeters are damaged by clipping due to high levels of sustained power. This happens when the wave goes flat at the top and bottom (clipped). This could be at any frequency. The woofer can handle this brief "DC" but the tweeter can not.
It has absolutely nothing to do with the amount of power required above 1K.
It has absolutely nothing to do with the amount of power required above 1K.
gedlee said:John, if its DC how does it get to the tweeter?
Hi Earl,
Notice the quotes around "DC". It's not really DC, that's how it can flash thru the filter cap.
For example:
When a 50Hz sinewave clips, the flat region contains harmonics of the fundamental - 3f, 5f, 7f, etc. These make the "flat" clip into an AC waveform itself, of higher frequency.
MJL21193 said:
Hi Earl,
Notice the quotes around "DC". It's not really DC, that's how it can flash thru the filter cap.
For example:
When a 50Hz sinewave clips, the flat region contains harmonics of the fundamental - 3f, 5f, 7f, etc. These make the "flat" clip into an AC waveform itself, of higher frequency.
So in other words the sinewave has its frequency content shifted upwards? Then wouldn't a complex waveform also have its frequency content shifted upwards? And isn't that what I said?
salas said:I did not write that spreadsheet. I have fished it at a point from the net. It says it is based on some 'best fit exponential curve' from some acoustics book. It asks for a password to unlock. So I cant extract the function for you. Its output just seems logical to me from practical experience.
P.S. Want me to email it to you, so you can find out more?
I am responsible for that spreadsheet.
http://members.optusnet.com.au/~gradds55/power.xls
(right click and save as)
It is based on the values that are given in the PA loudspeaker construction book I have floating about, for "normal" music , whatever that means. the values are obviously very rough estimates. !!!
I took the values that were in the book, then found the best sort of curve I could fit, which happened to be an exponential curve.
the "unlock" password is very obvious if you think about it and was only put there to stop people accidentally removing the formulas.

the original data is given on this page.
http://members.optusnet.com.au/~gradds55/power.jpg
I found the actual book, its and oldie, but a goodie.
"High Power Loudspeaker Enclosure Design and Construction" book. (published by Adam Hall in the UK).
http://members.optusnet.com.au/~gradds55/power.jpg
I found the actual book, its and oldie, but a goodie.
"High Power Loudspeaker Enclosure Design and Construction" book. (published by Adam Hall in the UK).
Andy Graddon said:
the original data is given on this page.
http://members.optusnet.com.au/~gradds55/power.jpg
I found the actual book, its and oldie, but a goodie.
"High Power Loudspeaker Enclosure Design and Construction" book. (published by Adam Hall in the UK).
Its a small world, isn't it? Andy did it!
So the estimations come from a pro installer author. That is why they looked 'normal' to me...
We are not normal people, don't listen to us!

Andy Graddon said:but they are all just boxes, cos you have to be able to pack and stack !!
Now you reminded me of a FOH guy that I helped recently by doing his thing for a few weekends when he had to leave his post. He said...''You did very well, the boss said the prima donna was happy. And...you look sturdy...don't tell me...too much PA ha?''
Cabs...gimme cabs!
Andy Graddon said:I can only fit so much in the back of the van, NEED MORE BASS !!!
Stack em under the stage centre. 2 side by side on the ground, another 2 on top, side by side. That way you will get their most if you have only 4.
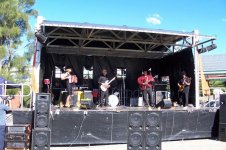
I never designed my stuff for outside gigs, but still do them occasionally.
http://members.optusnet.com.au/~gradds55/buddy knox band.jpg
mids and vocals , clean as, but not enough bass for outside
http://members.optusnet.com.au/~gradds55/buddy knox band.jpg
mids and vocals , clean as, but not enough bass for outside
Andy Graddon said:but not enough bass for outside
This would be the right picture...
Attachments
gedlee said:
Just for information, we do our power testing with White noise.
The reason is that we see field failures with the tweeter if we don't.
I suspect that its the clipping issue. Sure its overkill in some respects,
but it has saved us a lot of tweeters.
Hi,
I would of thought its fairly obvious the only thing white noise tests is the tweeter.
/sreten.- Status
- This old topic is closed. If you want to reopen this topic, contact a moderator using the "Report Post" button.
- Home
- Loudspeakers
- Multi-Way
- 3 Way Power Distribution