Thread Goals:
Deailed sound by using small, kinda-efficient drivers
CHEAP... CHEAP... CHEAP...
Anyone want to design a TMW Xover with these drivers?
Parts Express/
Vifa OX20SC $19 91db @2.83V
Faital 3FE25 $19 91db @2.83V
+ 8" Woofer like
CS8-3-28 8" Coated Paper Cone Woofer 4 Ohm $10
Model: CS8-3-28 Factory Buyouts 92.7db @2.83V
LineSource, I had to go back to double check but the OP has already bought the Fountek FE83's so I think we should be proceeding from there otherwise, yea, I'd model something up.
Not the same drivers here (FR88EX's) but pretty similar to what you are contemplating just to give you some ideas:
BoseBuster V2
Not the same drivers here (FR88EX's) but pretty similar to what you are contemplating just to give you some ideas:
BoseBuster V2
Linesource, that is almost exactly the plan I had in mind when I started out. Only difference was I had my eye on the RS225 for the woofer section. The Faital was the only 3" driver that claimed a high enough sensitivity, almost the only one at any price. The Scan Speak Discovery unit being the only other one I found. It is just that that SS one is expensive and I didn't want to do a build with it until I gained some experience with lower cost drivers. I was planning to do the woofer box separately. It would allow me to achieve a nice 3-way in stages. If it turned out that the first try MT box was not as good as I hoped for I would do that over with the benefit of the additional experience and using higher quality drivers in version 2.
PB - That commercially available 90 degree section MTM speaker is interesting. It looks like it has a greater C-to-C distance than what I proposed. It would also have very different vertical FR than a simple vertical MTM array.
I don't think I will be facing the problem of "bottoming out" the 3" woofers since I am using them as mids.
I have now got SPLTrace working and played a bit with FRM. The shapes allowed there for baffle simulation are pretty limited in FRM so I had a look at the other programs JR recommended. It seems like BDS has the most flexibility. Even that only allows up to 5-sided shapes. What I really need is to be able to run sims with a small rectangle sitting on top of a larger one, which amounts to an 8-sided object when you include the "shoulders" of the larger rectangle.
So, I tried to make due with a 5-sided shape as if the small rectangle was placed on the larger one with one side aligned with the side below. The opposite side then is two lines, so it is really a trapezoid underneath rather than a rectangle. Working with that sort of shape I was able to work out a few things.
I found that a 7" wide baffle with 1" radius chamfer on one side and a 1.5" chamfer on the other side gives a pretty smooth response. The drivers need to be offset towards the 1" chamfered side. Also, the tweeter response is best when it is placed a bit to the left of center relative to the two mids. Moving it an eigth of an inch either way makes a big difference to the response curve. I was surprised that such small changes made such noticeable differences. Also, having the baffle wider at the bottom than the top, a trapezoid, was better than a rectangle.
Overall, the take aways seems to be these:
Large radius edges, unequal, are advantageous
Offset drivers, and tweeter offset relative to mids is an advantage.
Mildly trapezoidal shape is an advantage.
I will fiddle some more with this modelled as a tall trapezoid since in the end the MTM unit will sit on top of a woofer box that is tall and relatively narrow. It only sits on a squat rectangle in the interim.
Attachments
Nice work. Your conclusions are valid although I would probably just say larger radius edges are better. Notice though that the scale of the BDS chart is fairly large so that 1dB changes can look kind of large but may not be that significant in the big picture.
Also, as I tried to say earlier, you want to try and think of the diffraction and FR responses together. If the FR has a peak and/or dip, can you get the diffraction response to cancel it out? You can still import both the FR frd and the diffraction frd into the FRM to see how they will sum together.
The Edge will allow you to model the shape you are interested in but it won't allow you to do any edge treatment (somewhat ironic given the name chosen for the program). The other pain is that it doesn't export frd files - you have to trace the diffraction curves you generate to be able to use them. That is a bit of a pain but there is more shape flexibility.
Nice work. Your conclusions are valid although I would probably just say larger radius edges are better. Notice though that the scale of the BDS chart is fairly large so that 1dB changes can look kind of large but may not be that significant in the big picture.
Also, as I tried to say earlier, you want to try and think of the diffraction and FR responses together. If the FR has a peak and/or dip, can you get the diffraction response to cancel it out? You can still import both the FR frd and the diffraction frd into the FRM to see how they will sum together.
Well, I am encountering a rub there. I'm sure it is because I am such a noob at this.
I can make a nice set of response curves in BDS but when I try to bring them into FRM I am not believing what I am seeing. I have been saving the responses from BDS for the individual drivers. I can not save the summed on-axis response for some reason. There may be some setting choice that wold allow that but I haven't found it.
So, if I save an individual driver response curve as an .frd file and then import that .frd file in FRM as a baffle import, one of the choices on the right side of the sheet, it lifts the response curve up into the 95-100 db range. The curve generated in BDS spans more than 7.5 db, and that appears to be getting added onto the basic driver curve in FRM, that curve having been created in SplTrace. This addition can not be right, can it?
Another thing that bugs me is that when I chose 2 drivers in parallel in FRM, that changes the impedance curve but it does not increase the output shown in the frequency response curve by ~6db. Why?
Again, I must be missing a setting somewhere. If the FR curve _had_ been raised ~6db as expected then I can't see how adding another ~6 makes any sense. It seems like this baffle response import should be done by multiplying by a ratio, not by adding a value. Is there a normalization step I am missing?
Another thing - when I open the BDS spreadsheet (compatibility mode in Excel 2010) I get a message saying that the user-defined function ISEVEN used in the sheet has the same name as a built-in function in Excel 2010 and that I have to change the name of the function in the macro. Really? Or are they both actually the same thing anyway?
Well, I am encountering a rub there. I'm sure it is because I am such a noob at this.
I can make a nice set of response curves in BDS but when I try to bring them into FRM I am not believing what I am seeing. I have been saving the responses from BDS for the individual drivers. I can not save the summed on-axis response for some reason. There may be some setting choice that wold allow that but I haven't found it.
Import FRD file to modify --> Import Baffle-Room data --> Save modified result to FRD file.
If that doesn't work then there is something not working properly with the program. Let me know.
So, if I save an individual driver response curve as an .frd file and then import that .frd file in FRM as a baffle import, one of the choices on the right side of the sheet, it lifts the response curve up into the 95-100 db range. The curve generated in BDS spans more than 7.5 db, and that appears to be getting added onto the basic driver curve in FRM, that curve having been created in SplTrace. This addition can not be right, can it?
Baffles diffraction can be modeled as a loss or a gain. Notice in both the diffraction section in FRM and the Baffle Diffraction and Boundary Simulator (which are the same program) that there is a button for this. You want to be using the loss model so that the HF are at 0dB and the LF end up at -6dB. Notice however than in BDS, it's modeled as a gain so that the HF are at 6dB and the LF are at 0dB. So when you go to save the responses in BDS, input a 'Ref Level (Db)' of -6 instead of 0. That should solve the problem.
Another thing that bugs me is that when I chose 2 drivers in parallel in FRM, that changes the impedance curve but it does not increase the output shown in the frequency response curve by ~6db. Why?
Again, I must be missing a setting somewhere. If the FR curve _had_ been raised ~6db as expected then I can't see how adding another ~6 makes any sense. It seems like this baffle response import should be done by multiplying by a ratio, not by adding a value. Is there a normalization step I am missing?
You are absolutely correct. The parallel wiring does raise the output by 6dB but doesn't show it. The reason is that the next step in this process is to import your modified frd files into a xo program like PCD (Passive Crossover Designer). Here, you will have to again identify what wiring configuration you are using and then you'll have to import an frd file for each of the drivers. This program will then do the proper calculation and give you the appropriate 6dB of SPL gain in its response charts. If FRM also did the same thing and then you imported it into PCD, the result would be incorrect by an extra 6dB. So in other words, FRM needs to export the result for a single driver and so that's what the program shows you.
It is a bit confusing though because, logically, you also need to export the impedance response for a single driver too but the impedance does change when you alter the driver wiring in FRM. So make sure that you revert back to a single driver when exporting driver impedance. There's actually an extra step with simulated impedance. Let me know when you get there and I'll explain.
I look at it this way - these are free programs and many of them have little idiosyncrasies. You sort of just have to figure them out and then work around them.
I tend to prefer Unibox for box modeling btw. I've never actually used anything but a single driver wiring in FRM.
Another thing - when I open the BDS spreadsheet (compatibility mode in Excel 2010) I get a message saying that the user-defined function ISEVEN used in the sheet has the same name as a built-in function in Excel 2010 and that I have to change the name of the function in the macro. Really? Or are they both actually the same thing anyway?
I've gotten that message as well. I'm not getting it now, so I can't remember what my response was. I think it was just, sure whatever and I just carried on without any problems.
It is a bit confusing though because, logically, you also need to export the impedance response for a single driver too but the impedance does change when you alter the driver wiring in FRM. So make sure that you revert back to a single driver when exporting driver impedance. There's actually an extra step with simulated impedance. Let me know when you get there and I'll explain.
JR - You are a huge help! I have now got reasonable looking graphs by saving the files from BDS with the -6db ref setting, further modified them in FRM, saved again, added the phase data using the nifty transform in FRM and saved final versions. I probably skipped the extra step in producing the simulated impedance that you mention above. I just forged ahead anyway to learn how to run PCD.
So, I have then imported these frd and zma files into PCD 7.0. It is really starting to look fun at this point, like some interesting experimentation will be possible. But, I have now run into a new stumbling block.
I can not figure out how to tell PCD I want to use two woofers. I can enter offsets for both, but it says second woofer is "not used". Where do you enter the choice that this will be an MTM or whatever overall type of design? Also, none of the spinners I have tried do anything. I must have skipped a step here somewhere. I have read the instructions but they seem to gloss over this particular point. I can either start by importing an existing profile file or just start entering driver data. Well, just entering driver names and offsets, importing the frd and zma files and flicking the spinners is not happening for me.
What really worries me is that I haven't found another post where someone has described the same very basic issue. Apparently I am really this lame ;-)
Datinker, I think you're doing quite well actually.
The spinner problem is something that just happened the other week due to good old MS updates that screwed up ActiveX controls in Excel. I had to revert my computer to a couple of days previous to that and I haven't downloaded them since then. See here for more info: PCD7 all of a sudden stopped working: any help?.
Getting 2 woofers to work in PCD is a simple matter of hitting the "Number of Woofers" control button -however if I recall correctly that isn't working any longer either.
If you don't have any luck getting PCD to work, you might want to try this non Excel version: David Ralph's Speaker Pages - Windows Passive Crossover Designer (WinPCD). It uses the same calculations as PCD but has a different user interface etc. It's still a bit of a work in progress, so it's not quite as functional as PCD.
Or, this is another new one that's supposed to be very good but which I haven't tried yet: XSim free schematic-based crossover designer program.
You haven't said it specifically but I assume that in FRM, you spliced the box response onto your raw FR and then added in the diffraction response. In terms of the impedance, getting it right helps to ensure that your xo simulation is more accurate since it's the impedance that the xo interacts with to change the FR.
So this will apply to any driver that you put into a box (so not the tweeter): trace the raw impedance above the resonance peak. You only need to trace enough points to maintain accuracy as it's just going to be a guide. Now in FRM, model the box impedance and then import your traced impedance as an overlay. Now adjust the modeled impedance above the new resonance peak so that it aligns with the imported overlay. Save it and then extract minimum phase.
You are sort of doing the same thing here with impedance as you do with the LF response when you model it in a box - it's the LF FR and the LF impedance that change due to the box, but the FR and impedance above about 100/200Hz stay the same. With the FR, you splice the responses together, but with the impedance, you modify the modeled response above the peak to match the raw impedance. Frequently, they are fairly similar but they are often off by a fair amount too. I suggest it's worth taking the extra step.
Btw, if you haven't read these yet, I think you should be ready for them now:
Some optimization criteria... and some tips... - Blogs - Techtalk Speaker Building, Audio, Video Discussion Forum
Tips, Volume 2- The setup!! - Blogs - Techtalk Speaker Building, Audio, Video Discussion Forum
"Tips! Volume 3"... - Blogs - Techtalk Speaker Building, Audio, Video Discussion Forum
Jeff B’s Thoughts on Passive Crossover Design
Datinker, I think you're doing quite well actually.
The spinner problem is something that just happened the other week due to good old MS updates that screwed up ActiveX controls in Excel. I had to revert my computer to a couple of days previous to that and I haven't downloaded them since then. See here for more info: PCD7 all of a sudden stopped working: any help?.
OK, I found the pesky MSForms.exd file and deleted it. After restarting Excel PCD is working as expected. Yahoo!
You haven't said it specifically but I assume that in FRM, you spliced the box response onto your raw FR and then added in the diffraction response. In terms of the impedance, getting it right helps to ensure that your xo simulation is more accurate since it's the impedance that the xo interacts with to change the FR.
So this will apply to any driver that you put into a box (so not the tweeter): trace the raw impedance above the resonance peak. You only need to trace enough points to maintain accuracy as it's just going to be a guide. Now in FRM, model the box impedance and then import your traced impedance as an overlay. Now adjust the modeled impedance above the new resonance peak so that it aligns with the imported overlay. Save it and then extract minimum phase.
It sounds like you are saying running the box model does not actually alter/update the imported (SPLtrace) impedance curve in FRM? It looks like it does when you choose ported as box type. I am using sealed and I can't see any difference with or w/o box settings. I don't understand why you want a second imported overlay when it is the same as the original curve anyway (?).
You are sort of doing the same thing here with impedance as you do with the LF response when you model it in a box - it's the LF FR and the LF impedance that change due to the box, but the FR and impedance above about 100/200Hz stay the same. With the FR, you splice the responses together, but with the impedance, you modify the modeled response above the peak to match the raw impedance. Frequently, they are fairly similar but they are often off by a fair amount too. I suggest it's worth taking the extra step.
Ahh, so the impedance _should_ always stay the same above the peak regardless of the box but sometimes the FR software process changes it for some reason? OK. Something to watch for.
Btw, if you haven't read these yet, I think you should be ready for them now:
Some optimization criteria... and some tips... - Blogs - Techtalk Speaker Building, Audio, Video Discussion Forum
Tips, Volume 2- The setup!! - Blogs - Techtalk Speaker Building, Audio, Video Discussion Forum
"Tips! Volume 3"... - Blogs - Techtalk Speaker Building, Audio, Video Discussion Forum
Jeff B’s Thoughts on Passive Crossover Design
Yes, I have read those posts but I'm sure I will be reading them again as I work along and start to wonder about this and that.
Speaking of which -
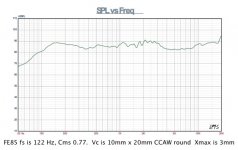
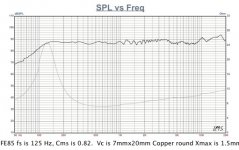
After an initial go at combining the woofer and tweeter responses in PCD I see that the left declining slope of the slump in output from about 3000 to 8500 Hz in the FR of the FE83 will probably have to be used as a crossover point.
I think what is going on there is not really a drop in output, but the consequence of there being a bunch of resonances just before, from about 1000 to 3000 Hz. Otherwise the FR graph of this driver should look like that of the FE85, which is wonderfully flat all through that region.
I am wondering if the cluster of resonances are the result of somehow faulty cones or if they are somehow caused by the reduced compliance in the spider and the longer VC length used to get the larger Xmax of the FE83 as compared to the FE85. The faulty cone theory might explain why these are in the buyout bargain bin. It is hard to imagine why the factory wouldn't have used he same cone on both drivers, but maybe they had a batch that didn't meet specs and so here they are on clearance.
Attachments
I think you've got the impedance thing. Below is an example. Blue is modeled in a sealed box and grey is the measured infinite baffle impedance response. Just a small difference this time but I would still modify the blue curve to match the grey one from about 1kHz to 10kHz especially if you were crossing over at about 3kHz for example.
You can use the spinners for the Le coeff. and/or expon. to make the changes and/or you can use the equalization modules to the left.
Sorry, I have no insight into the FE83.
You can use the spinners for the Le coeff. and/or expon. to make the changes and/or you can use the equalization modules to the left.
Sorry, I have no insight into the FE83.
Attachments
A simulating adventure
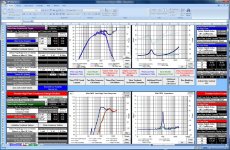
I have now spent some (quite a bit of) time fiddling with the driver data set up in the BSD and FRM programs. Note that for the tweeter I traced out curves from Zaphs pages where he made measurements on the Vifa OX20 in a 45 degree bevel since I plan to use the tweeter in some similar waveguide offset. Recessing the tweeter already causes some drop in the high end. I initially set 3rd order Butterworth slopes as target values and played with crossover points in the 1.8-3 kHz range. I found that I needed a notch filter on the tweeter resonance peak at 1060 Hz to get a decent match to the target slope and a good summed response so I have kept that in through all further digital experimentation.
I started with the assumption that I would need second order electrical filters to match the target curves (acoustic responses). That works out pretty well for the woofers but for the tweeter I just couldn't get a match unless I took it to third order electrical. And then I finally found that the rising response of the FE83s above about 8 kHz was causing some cancellation of the high frequencies produced by the tweeter. I found that adding another cap to the mid circuit brought up the sagging top end response. Just a Zobel plus 2nd order electrical wasn't enough.
Now working with 3rd order filters I find I can get a very nice summed response and a pretty smooth relationship of 90 degs relative phase difference between the woofers and tweeter through the crossover region with the drivers wired in normal phase. If I understand correctly this is the original D'Appolito configuration. I have attached screenshots of these simulation results. Layed out like this the impedance drops to about 2.5 ohms at one point. That seems pretty low. I'd be interested in suggestions about how to bring that up without upsetting he overall plan too much. Another improvement might be to somehow move the point where the woofer phase starts climbing to extend the region of 90 degree overlap as far as the tweeter phase response allows. Does the Zobel compensation affect this?
Also, in general the numerous small peaks in the FR curve of the FE83 are amplified when using two of them. I think I will be doing some experimentation with cone stiffening/dampening tweaks to see if some of this can be cleaned up. These curves could look a lot better if I were working with the FE85s frequency response for instance.
Attachments
Just some quick observations.
- the acoustic center of the Founteks should be in negative units
- the phase should always be aligned in the xo region.
- the xo point looks like a good one for the drivers
- this can vary with how much LF you want, but it looks like the speaker sensitivity is too high at about 90dB. The Founteks look to be at about 84dB in the midrange, so 2 in parallel should get you 90dB but then you should be fully compensating 6dB for baffle step loss (bsc) so the PCD summed response should be closer to 84dB than 90dB. I think your tracing is probably accurate so what you need to do is bring the level down more on the FE83's with a bigger inductor to start off with. You usually look at about the level at 200Hz and then set your target for that dB level, which looks to be about 85dB.
- bringing the FE83 levels down also means that you'll need to add resistance to bring the tweeter level down as well. That will raise the impedance on the tweeter anyways. But I'm not sure which driver is the culprit here (or both) in your low impedance result as you haven't got the filtered impedance curves turned on for either of the drivers.
- a fairly low inductor value of .13mH for L3 on the tweeter can also bring the impedance levels down
- experiment with resistance in either of the drivers' parallel legs. It can be quite useful in shaping the response and in fine tuning phase.
- I'm not really sure that the tweeter needs the impedance compensation filter. The impedance peak is not really excessively large at about 12ohms. Maybe move the xo point north a little bit if you have to or if you can.
- I'm not really liking that 5500Hz peaking on the tweeter and the drop afterwards. I would perhaps start by trying to drop it via baffle diffraction though I'm sure you've spent lots of time on that already. What are the baffle dimensions and driver positions you decided upon and how did you solve your modeling dilemma?
- and just sort of a common sense thing: try not to make your xo too complex when working with inexpensive drivers. You'll end up spending way more on xo parts than what you spent on drivers.
Despite all that, I'd say your learning curve is moving along nicely.
Just some quick observations.
- the acoustic center of the Founteks should be in negative units .
Oooh, that could be a big mistake. I thought I read in the instructions that the tweeter should be set at zero in X, and the mids should then be forward in X (positive units) if the tweeter is recessed in a waveguide.
Would it matter if the mids were set at zero and the tweeter was placed at negative X by the same amount?
Check the specs of the D'Appolito Array alignment on this point. I know it sounds like an odd duck but I'm pretty sure it uses quadrature at X/O (see Biro Technology) . I was kind of surprised to see that it worked in the simulation.- the phase should always be aligned in the xo region.
I can also set the speaker up with 2nd order electrical slopes and negative polarity on the Tweeter and make a nice curve that gives a good null if I reverse the tweeter wiring.
I plan to optimize for both cases and see how they look. I may even build both X/Os so I can give the cases a listening test.
- this can vary with how much LF you want, but it looks like the speaker sensitivity is too high at about 90dB. The Founteks look to be at about 84dB in the midrange, so 2 in parallel should get you 90dB but then you should be fully compensating 6dB for baffle step loss (bsc) so the PCD summed response should be closer to 84dB than 90dB. I think your tracing is probably accurate so what you need to do is bring the level down more on the FE83's with a bigger inductor to start off with. You usually look at about the level at 200Hz and then set your target for that dB level, which looks to be about 85dB.
I have not done anything for BSC in this case since the plan is to use this unit as the midrange section of a 3-way. I was lucky that the mids and tweet came out at the same level without any padding resistance. Thought I'd leave that alone for now, until I decide at what level I need them to be for the low-to-mid X/O.
- bringing the FE83 levels down also means that you'll need to add resistance to bring the tweeter level down as well. That will raise the impedance on the tweeter anyways. But I'm not sure which driver is the culprit here (or both) in your low impedance result as you haven't got the filtered impedance curves turned on for either of the drivers.
Ah, I missed a trick there. Next time I get at the PC for a while I will find and turn on the filtered impedance curves. It will probably answer my question...
I am amazed at how much this PCD spreadsheet does!
- experiment with resistance in either of the drivers' parallel legs. It can be quite useful in shaping the response and in fine tuning phase.
Thanks for that tip. I will see what I can do with it.
- I'm not really sure that the tweeter needs the impedance compensation filter. The impedance peak is not really excessively large at about 12ohms. Maybe move the xo point north a little bit if you have to or if you can.
I put that in there because I was trying to get rid of a knee in the roll-off. It might not be needed for that at a higher X/0 frequency, but lower is better in view of the M-M interactions.
- I'm not really liking that 5500Hz peaking on the tweeter and the drop afterwards. I would perhaps start by trying to drop it via baffle diffraction though I'm sure you've spent lots of time on that already. What are the baffle dimensions and driver positions you decided upon and how did you solve your modeling dilemma?
I'm not liking it either. I think this comes from the fact that I used the curve from Zaph's site where the OX20 was mounted in a shallow waveguide here in the PCD simulation, but I did not use that curve when I was playing with the arrangement in BSD modelling. I will need to go back and optimize with the waveguided version of the OX20 curve before any final decisions are made on the physical arrangement. The OEM curve, presumably on a flat baffle, just has a rising response from 15k Hz to the end.
- and just sort of a common sense thing: try not to make your xo too complex when working with inexpensive drivers. You'll end up spending way more on xo parts than what you spent on drivers.
Despite all that, I'd say your learning curve is moving along nicely.
Yes, good point about the complexity and cost. For now I was playing the "whatever it takes to shoehorn these guys into a D'Appolito configuration game" in the sim. I have been collecting sale caps for a while and winding coils from wire salvaged from old transformers so I can spend time to save money on parts if necessary. It is, after all, DIY audio. ;-) But before going to all that trouble I would hope to simplify the parts count as much as possible in the software before actual building. And your comments will certainly help me do that. Thanks for following this thread all this time. I definitely owe you a beer if you are ever in Seattle.
Looks like you were right for the acoustic center. I was too quick on that one and failed to consider that the tweeter was recessed.
Yes, 3-way. I forgot about that too. Actually what you should probably do is add a HP capacitor to the mids as well as opposed to just using the natural roll-off to merge with your woofer. For that, you should change the wiring configuration to a 3-way parallel in PCD, re-load the FE83's as the mids and then use the Remove Woofer button. You'll find that the HP capacitor may also affect the response higher up in frequency sometimes. I'd probably start shooting for a xo point around 400Hz.
I'll admit that I haven't read much about a true D'Appolito configuration and so I am surprised to see that there is talk of the tweeter and woofers being out of phase but I really wonder if it's done at all in practice. But, hey give it a shot - it might be a good learning experience. In PCD, turn on the Power Response in your top chart to see what the composite of all the off-axis responses look like, but also use the Horizontal Panning spinners to make sure you are not getting any peaking in the xo region as you move off-axis as well. My thinking though is that since the drivers are out of phase in the xo region, that means that the same sounds from the 2 different drivers will be arriving at your ears at different times which is usually not considered to be a good thing. It should mean a smearing of the signal as far as I know.
From what I understand, D'Appolito himself has moved away from 3rd order Butterworth to 4th order LR filters now (acoustic).
Try those resistors in the parallel leg - they are particularly good at shaping the roll-off knee.
Have you bought those tweeters yet btw? I'm wondering if you might prefer their sibling the OT19NC00 - it maybe has just a slightly smoother FR. Just a thought anyways.
Ah.... been to Seattle twice. I used to live in Vancouver and Whistler. Now I'm sorry to say that I am permanently stuck in Toronto. Thanks for the offer though.
Yes, 3-way. I forgot about that too. Actually what you should probably do is add a HP capacitor to the mids as well as opposed to just using the natural roll-off to merge with your woofer. For that, you should change the wiring configuration to a 3-way parallel in PCD, re-load the FE83's as the mids and then use the Remove Woofer button. You'll find that the HP capacitor may also affect the response higher up in frequency sometimes. I'd probably start shooting for a xo point around 400Hz.
That is exactly what I was thinking, when I progress the model to include the complete 3-way scenario I would have to add in a woofer response curve and I would try for X/) around 400 Hz.
I'll admit that I haven't read much about a true D'Appolito configuration and so I am surprised to see that there is talk of the tweeter and woofers being out of phase but I really wonder if it's done at all in practice. But, hey give it a shot - it might be a good learning experience. In PCD, turn on the Power Response in your top chart to see what the composite of all the off-axis responses look like, but also use the Horizontal Panning spinners to make sure you are not getting any peaking in the xo region as you move off-axis as well.
Ah, so power response represents an average of response over the range of axes, sort of a 3-D frequency response integral? I wasn't sure how to picture what power response is. If that is a fair definition, than great. I can grok it.
I have looked at the power response curves of this filter arrangement and it is almost coincident with the summed frequency response to part way up the tweeters range, then it starts dropping below the sum line. Which seems pretty good. It doesn't seem like anything I try can keep it coincident all the way through the tweeters range. But a steeper X/O that drops the rising response of the mid's top end could conceivably help a bit more.
My thinking though is that since the drivers are out of phase in the xo region, that means that the same sounds from the 2 different drivers will be arriving at your ears at different times which is usually not considered to be a good thing. It should mean a smearing of the signal as far as I know.
Ditto for me. I don't really understand why this alignment works well. But then, I haven't read the original paper either. It seems to simulate pretty well.
From what I understand, D'Appolito himself has moved away from 3rd order Butterworth to 4th order LR filters now (acoustic).
That appears to be the case all right. I just thought his original concept may be worth a try with small drivers like this.
Try those resistors in the parallel leg - they are particularly good at shaping the roll-off knee.
Will do.
Have you bought those tweeters yet btw? I'm wondering if you might prefer their sibling the OT19NC00 - it maybe has just a slightly smoother FR. Just a thought anyways.
I think you are right about the FR curves of the two tweeters. However, the curves are pretty strongly affected by how you mount and wire the units anyway. More importantly, IMHO, is that the OT19 has a higher Fs that is going to create trouble for me trying to use a ~2 kHz X/O point.
Oh well. We'll just have to go with the "it's the thought that counts" sentiment. Oh, I see they have a smiley for this occasionAh.... been to Seattle twice. I used to live in Vancouver and Whistler. Now I'm sorry to say that I am permanently stuck in Toronto. Thanks for the offer though.

re power response: yes that's it exactly. Don't worry too much about the way it drops above 6 or 7kHz though - this is absolutely normal with most tweeters not in a waveguide, as they become more and more directional at higher frequencies. Keeping it flat through the xo ranges can be the hard one, although many people suggest a drop in the ear's sensitive 1 to 3 or 4kHz range is actually a good thing.
Fs for those tweeters are so close as to be negligible. Funny though that factory specs show the OX20 as flatter but Zaph's recessed measurements I think give the OT19 just the tiniest edge. No biggy.
Fs for those tweeters are so close as to be negligible. Funny though that factory specs show the OX20 as flatter but Zaph's recessed measurements I think give the OT19 just the tiniest edge. No biggy.
JR, Yes, you were right about the Vifa mini-tweeters. I was incorrectly remembering that there was a difference in Fs when it was really a difference in sensitivity that I had based that choice on. I went back to Zaph's site today and found that the xt19 in a simple round-over waveguide did indeed have the better response so I worked through the modelling process again with that as the chosen tweeter. It definitely works out better that way. This seems to be typical that ring radiators work better in waveguides than domes.
Now I just have to get the midwoofs under control.
Oh, I tried using resistor or RC shaping filters in the X/Os as well. That is a viable alternative to zobels and RLC notches, and it can shore up the system impedance. In fact I ended up with a rising impedance that looks just like the curve for a raw driver. Probably not a good thing overall. I may need to put a zobel back in there now.
This is such a fiddly process!
Oh cool. I've actually got a pair of those XT19's sitting around waiting for me to do something with. Hopefully this summer........
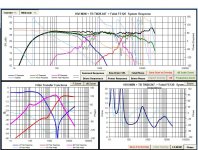
Don't fall into the trap of thinking that the system impedance needs to be flat. The Rocky mountains is fine for today's solid state amps as long as the minimum impedance is above the amps minimum and the impedance phase isn't going above/below 60/-60 degrees.
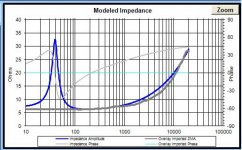
Below is the chart for Jeff B's latest design (he's the one who wrote the PCD software). Impedance (blue) is actually fairly mellow but it's certainly not flat. And rising in the top end is no big deal. The FR is flat and that's what matters.
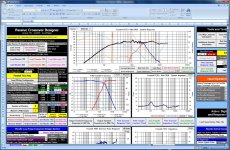
And the 2nd pic shows a 3-way I was working on lately. That one was a little challenging as they weren't the easiest drivers to work with but that still shouldn't be a problem for an average amp.
One other thing to watch for is that a low impedance phase around -60* doesn't coincide with a low impedance at the same frequency - that can be a tough load for an amplifier.
Don't fall into the trap of thinking that the system impedance needs to be flat. The Rocky mountains is fine for today's solid state amps as long as the minimum impedance is above the amps minimum and the impedance phase isn't going above/below 60/-60 degrees.
Below is the chart for Jeff B's latest design (he's the one who wrote the PCD software). Impedance (blue) is actually fairly mellow but it's certainly not flat. And rising in the top end is no big deal. The FR is flat and that's what matters.
And the 2nd pic shows a 3-way I was working on lately. That one was a little challenging as they weren't the easiest drivers to work with but that still shouldn't be a problem for an average amp.
One other thing to watch for is that a low impedance phase around -60* doesn't coincide with a low impedance at the same frequency - that can be a tough load for an amplifier.
Attachments
- Status
- This old topic is closed. If you want to reopen this topic, contact a moderator using the "Report Post" button.
- Home
- Loudspeakers
- Multi-Way
- 2 small midranges - potentially as good as one large one?