Thank you so much, David. It's such a joy to use.
Hi Giri,
Not a problem - pleased to hear that it is working well for you.
Kind regards,
David
Hey David,
thank you for hornresp it is a great tool! Reading high quality horn loudspeakers (great book btw), seeing the pictures with the Hollerith cards made me smile, horn resp is actually older than I am") .
.
Reading the book, I got interested to understand which equations hornresp uses or more specific how does hornresp couple a driver with TS parameters to a horn, closed rearchamber and so on.
searching the Thread I understand how you for example extract Mmd from the TS parameters. Anyhow I am just intrested to understand hornresp better and would be thankful for some insight.
kind regards,
finn
thank you for hornresp it is a great tool! Reading high quality horn loudspeakers (great book btw), seeing the pictures with the Hollerith cards made me smile, horn resp is actually older than I am
.Reading the book, I got interested to understand which equations hornresp uses or more specific how does hornresp couple a driver with TS parameters to a horn, closed rearchamber and so on.
searching the Thread I understand how you for example extract Mmd from the TS parameters. Anyhow I am just intrested to understand hornresp better and would be thankful for some insight.
kind regards,
finn
Quick (and probably stupid) question regarding the polar plot:
Where is the centre of the plot located? Is it
1. the centre of the plane of the horn mouth
2. the centre of the spherical wavefront at the horn mouth
3. the centre of the plane of the horn throat
4. the apparent origin of the sound where the sound may be perceived as coming from
( which lies between points 1 and 3, usually closer to 1)?
Also, can the distance between the centre and the measurement point be adjusted? If the horn mouth is fairly large, standing further away might provide better insight (as well as be more prudent!).
Hornresp Update 5050-200109
Hi Everyone,
CHANGE 1
Holding down the Ctrl key while pressing the F6 function key or clicking the Import command button now suppresses the importation of the driver parameter values when a BOXPLAN update is loaded into the loudspeaker wizard.
CHANGE 2
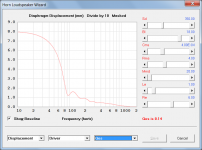
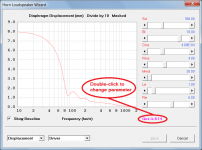
The Thiele-Small parameter displayed below the Re slider control in the loudspeaker wizard is now selected by double-clicking on the parameter label rather than by choosing from a drop-down list box. Attachment 1 shows the old method, Attachment 2 shows the new method.
Kind regards,
David
Hi Everyone,
CHANGE 1
Holding down the Ctrl key while pressing the F6 function key or clicking the Import command button now suppresses the importation of the driver parameter values when a BOXPLAN update is loaded into the loudspeaker wizard.
CHANGE 2
The Thiele-Small parameter displayed below the Re slider control in the loudspeaker wizard is now selected by double-clicking on the parameter label rather than by choosing from a drop-down list box. Attachment 1 shows the old method, Attachment 2 shows the new method.
Kind regards,
David
Attachments
Hi SamAnytime,
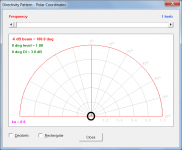
Just to clarify - I assume that when you say "polar plot" you are referring to the Hornresp directivity pattern in polar coordinates and not the directivity polar map, and that when you say "centre of the plot" you are referring to the point circled in black in the attachment, and not the green zero degree axis line. Is this correct?
Kind regards,
David
Attachments
I got interested to understand which equations hornresp uses or more specific how does hornresp couple a driver with TS parameters to a horn, closed rearchamber and so on.
Hi finn,
Unfortunately it is not really possible to explain in a meaningful way how the Hornresp simulation models work without getting into highly technical detail. Chapters 16 and 19 of the horn book will give you a good insight into the theory and principles involved. In essence, Hornresp uses the equivalent circuit shown in Figure 16.6.1(a). Note that the electro-mechanical driver parameters Sd, Bl, Cms, Rms, Mmd, Le and Re (as shown on the Input Parameters window) are used in the model, rather than Thiele-Small parameters. Note also the comments in Section 16.5 relating to the complexity of the acoustical side of the model.
The Hornresp simulation model algorithms run into tens of thousands of lines of code - it is not just a simple matter of applying a few equations...
.Kind regards,
David
Yes. I can mentally convert the directivity pattern to the circular form, so I can use that info for that plot as well. I want to know the correlation with the physical measurement technique where you put the speaker on a turntable, or put the microphone on a boom and rotate it so it remains equidistant from the source.Hi SamAnytime,
Just to clarify - I assume that when you say "polar plot" you are referring to the Hornresp directivity pattern in polar coordinates and not the directivity polar map, and that when you say "centre of the plot" you are referring to the point circled in black in the attachment, and not the green zero degree axis line. Is this correct?
Kind regards,
David
Yes. I can mentally convert the directivity pattern to the circular form, so I can use that info for that plot as well. I want to know the correlation with the physical measurement technique where you put the speaker on a turntable, or put the microphone on a boom and rotate it so it remains equidistant from the source.
I believe Hornresp uses a Far-field approximation model for directivity, i.e. that the directivity pattern is calculated as it would appear if you measured it at a very large distance, but the level is scaled back to a 1m distance. Otherwise you would have to specify a measurement distance and point of rotation, and there would be a large variation in the pattern depending on those values.
If the measurement point is very far away, these variations become insignificant, and the actual rotation point does not matter.
What is "very far away" depends on the size of the source (horn mouth) and also on the "apparent apex" or centre of curvature of the far field wave front.
In addition, there are near field effects. These typically happen when the distance is shorter than (Source area)/(wavelength), this distance is called the Rayleigh distance. At larger distances the pressure varies as 1/distance, but closer to the source the variations do not follow this law, and have peaks and dips you wouldn't see at a greater distance.
These effects are usually not a problem when measuring small devices like direct radiators and small horns, but most horns are large enough that they become noticeable, especially at the standard distance of 1m.
When measuring horns, it is usually recommended to rotate them around the "apparent apex". This will avoid distortion of the directivity pattern at short distances compared to the far field pattern.
Also note that Hornresp uses one-dimensional horn models, so the directivity models are only approximations.
I want to know the correlation with the physical measurement technique where you put the speaker on a turntable, or put the microphone on a boom and rotate it so it remains equidistant from the source.
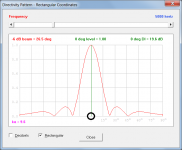
The Hornresp directivity pattern is simply a plot of the far-field pressure calculated at different off-axis angles. The centre point of the pattern represents zero on the pressure and angle axes, it has nothing to do with the physical location of the speaker or the microphone. It may be easier to understand if you look at the rectangular coordinates chart rather than the polar coordinates chart.
The Hornresp one-parameter directivity models show the basic characteristics, but give indicative values only. You may find that your actual measured results are somewhat different to those predicted by Hornresp.
Attachments
I believe Hornresp uses a Far-field approximation model for directivity, i.e. that the directivity pattern is calculated as it would appear if you measured it at a very large distance, but the level is scaled back to a 1m distance.
Hi Bjørn,
You beat me in posting by a few seconds...
.Just to clarify, the Hornresp directivity pattern results are normalised to a maximum of 1, not scaled back to a 1m distance
.Kind regards,
David
Just to clarify, the Hornresp directivity pattern results are normalised to a maximum of 1, not scaled back to a 1m distance
Yes, I was thinking about the frequency response plot when I mentioned the 1m distance.
Hi finn,
Unfortunately it is not really possible to explain in a meaningful way how the Hornresp simulation models work without getting into highly technical detail. Chapters 16 and 19 of the horn book will give you a good insight into the theory and principles involved. In essence, Hornresp uses the equivalent circuit shown in Figure 16.6.1(a). Note that the electro-mechanical driver parameters Sd, Bl, Cms, Rms, Mmd, Le and Re (as shown on the Input Parameters window) are used in the model, rather than Thiele-Small parameters. Note also the comments in Section 16.5 relating to the complexity of the acoustical side of the model.
The Hornresp simulation model algorithms run into tens of thousands of lines of code - it is not just a simple matter of applying a few equations...
Kind regards,
David
Hey David,
i can imagine that hornresp has quiet a few lines of code. I was just interested to understand what the undyling equations were, because I couldn't find any infortmation on that. And that I know now, thank you very much.
Kind reagrds
Finn
Hi Giri,
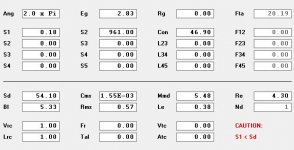
I think I might know what is causing the strange results, but could you please post a screencopy of the main Input Parameters window so that I can check for sure.
Kind regards,
David
Here's the screenshot, David
Attachments
Here's the screenshot, David
Thanks Giri.
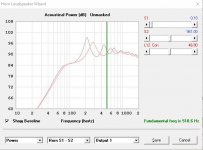
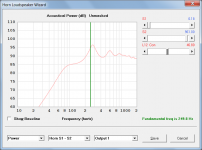
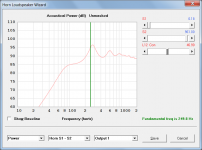
I have found the problem, and it will be fixed in the next update. The fundamental resonance frequency for your test design should actually be 249.8 Hz for both 46.8 and 46.9, as shown in the attachments.
Many thanks for reporting this issue. Even though it only occurs in extreme cases (the horn throat in your design is less than 4.7mm in diameter) the problem still needs fixing - I doubt that I would have ever found it myself
.Kind regards,
David
Attachments
Hi all,
First of all thank you very much to the creater of the Hornesp!
I have a problem with Hornesp, I obtain an SPL higher than about 10dB respect the speaker sensitivity. If I use the SW Trasmission line of Leonardaudio I obtain the correct SPL.
I think that maybe Hornesp use more than 1W to plot the graph.
In addition, Is the diagrahm of displacement calculated at the maximum power?
Thank you at all!
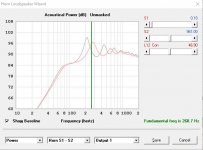
The fundamental resonance frequency for your test design should actually be 249.8 Hz for both 46.8 and 46.9.
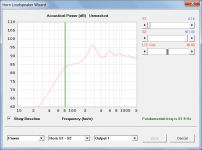
I had only half-fixed the problem. The fundamental resonance frequency for the test design is actually 81.9 Hz for both 46.8 and 46.9.
Attachments
- Home
- Loudspeakers
- Subwoofers
- Hornresp