there are various files that are called out as being needed. They should be included in the same directory as the .asc (in the simplest case). Do you have the various .lib files listed in the .asc file?
there are at least 3...zener, LED, and jfet
None of the libraries nor subcircuits were included. The poster did not want to post his personal libraries.
Another stupid question. I've looked through the thread and haven't found it. When you have a wire or component that has both AC and DC on it how do you make the 'voltmeter' and or 'ammeter' measure AC and DC discretely?
AC and DC analysis are spice directives. Directive begin with a .
.op is operating point (DC)
.tran is transient (AC)
Attached are the tutorials from the beginning of this thread.
Attachments
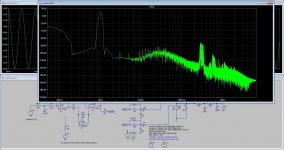
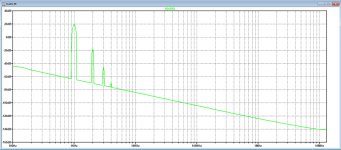
high 60Khz signal
Is -70dB (relative to the fundamental) high???
Maybe the behavior under 1.3...1.4kHz is more interesting.
Is -70dB (relative to the fundamental) high???
Maybe the behavior under 1.3...1.4kHz is more interesting.
It is because of only thirth harmonic is present, 60Khz whil 40 Khz is not, that is strange.
Here i get better results when using 1 Khz and not 20 Khz, possible it has a other cause, these sim is a D amp with voltage feedback and extra integrator for bigger open loop, it can also be clocked...
regards
Attachments
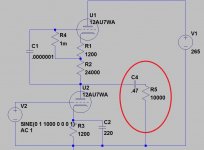
1m=1miliohm or .001 ohms. Use Meg for million ohms, i.e. 1meg. That's why your sim isn't working as expected.Hey Anyone,
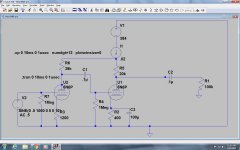
I'm trying to simulate a preamp model. The one thing I don't understand is how to model the power amp which is actually the load. I tried a simple resistor but that doesn't seem to work. Any suggestions?
Kevin
C2 220=220 Farads, that's one helluva big cap. I assume you want 220u, u=micro, (e-06) for microfarads.
You can shorten the value for C1 to .1u or 100n. n=nano (e-09). p=pico (e-12), no need to type out all those zeros.
Not knowing exactly what power amp you are planing on driving with this circuit, 100k would be a more reasonable load, if it's a tube circuit. Solid State is another story. Only you know this since you didn't specify...
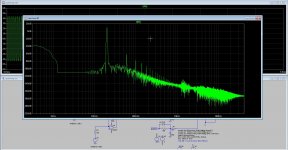
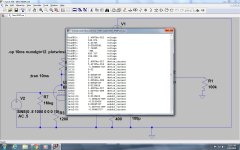
Thanks guys, your advice helped a lot. Again. I'm posting an FFT of the preamp design. While my question isn't specifically a Spice question it arises from Spice and should be easy to answer. The run is set at .5 volt input at 1k with a 30 volt output swing. My question is this, there is a large bump in distortion at 140k. Is that distortion parasitics? And is there way to eliminate it? Or does it even need to be eliminated?
Attachments
Last edited:
Sorry, attached is the circuit I'm working on. The circuit in the earlier post was a known good circuit I was using to work with Spice.I think your added instructions go under DC operating point? That's where I put them and I got the table of voltages and currents. How do I get back to the graph?
Attachments
Last edited:
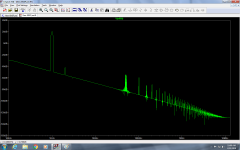
to get your graph...
1. left click output node to display time waveform.
2. right click over that graph...select View=>FFT
3. accept the defaults in the FFT screen for now, but under "Time range to include" select "Specify a Time range", and then just pick the last millisecond of your sim...That will clean up a lot of the FFT slope.
- Home
- Design & Build
- Software Tools
- Installing and using LTspice IV (now including LTXVII), From beginner to advanced