If you put the tweeter from the Vanderkooy measurement on an infinite baffle and measured the impulse response with mic on the baffle at 1/2 meter from the tweeter you would see an impulse magnitude of about 20% of the on-axis impulse magnitude. With r of about 0.5(typical value), this would produce a diffraction source of 10% magnitude(relative to on-axis) with opposite phase. So behind the shadow boundary you would see a source with strength [ +20% + (-10%) ] = +10%.… if the combination of reflection coefficient and 90 degree response adds up to 10% amplitude for the edge reflection, you still need to answer how we get 10% at the front (inverted) and 10% to the rear (equal strength), when the rear is defined by 1-r (giving 90% in my mind).
Why are the front and rear reflections (diffractions) equal amplitude?
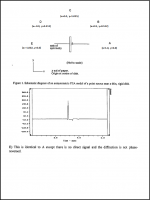
There was another AES diffraction paper(J. R. Wright, J. Audio Eng. Soc., “Fundamentals of Diffraction,” vol 45, pp. 347–356 (1997 May) that used FEA techniques to analyze a point source on a 132mm diameter baffle. These results may be easier to understand without finite size source effects muddying the results.
I pulled together figures and comments from the paper for angles of 0, 30, 90, 150, & 180 degrees.
The comments for C(ie90deg) are … interesting.
Attachments
Last edited:
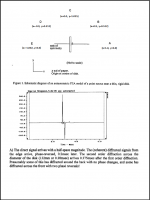
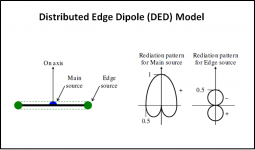
OK, here we agree on same result but not on how it is modelled :These two figures are showing the same thing but using different terms...
Again, there is a difference between modeling edge diffraction by placing a monopole source at an edge (right figure) and looking at the result of diffraction (left figure).
An externally hosted image should be here but it was not working when we last tested it.
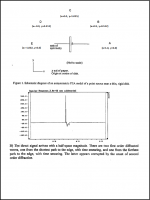
on the right picture, there is some direct signal (red) behind the edge, radiating backward, where does this signal come from ?
I don't understand : it cannot come from incident source because it is on the shadowed side and it doest not come from the secondary source (blue).
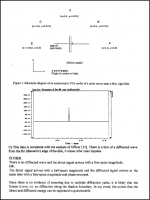
And how would you explain the picture C (90°) from Wright and showed above by bolserst ?
Because in the dipole diffraction model that I showed, it fits with Wright's comment : there is no diffracted wave and the direct signal arrives with free-space magnitude.
Last edited:
The comments for C(ie90deg) are … interesting.
Yes, "no diffraction along the shadow boundary" would agree with a dipole source for secondary radiation.
David
…the dipole diffraction model that I showed, it fits with Wright's comment : there is no diffracted wave and the direct signal arrives with free-space magnitude.
This isn’t quite true. The model you posted had the direct signal arriving with half-space magnitude.
Note that in the DED paper, the model uses a direct signal magnitude that is a function of listening angle (Ps=(1+cos(θ))/2).
Attachments
If you put the tweeter from the Vanderkooy measurement on an infinite baffle and measured the impulse response with mic on the baffle at 1/2 meter from the tweeter you would see an impulse magnitude of about 20% of the on-axis impulse magnitude. With r of about 0.5(typical value), this would produce a diffraction source of 10% magnitude(relative to on-axis) with opposite phase. So behind the shadow boundary you would see a source with strength [ +20% + (-10%) ] = +10%.
0, 90, 150, & 180 degrees.
Both the Wright paper and the Vanderkooy paper are interesting.
All of these diagrams with r and 1-r (including your example) have the problem that they only work if r is 0.5. Any other value means the forward reflection and rearward diffraction are not the same strength. Both Wrights predictions and Vanderkooys measurements show equal strength.
What if r is 0.3? The re-radiation doesn't balance.
David S
I think that I never gave the level of direct signal at the edge, did I ? I just gave the proportion of reflected and diffracted parts r and (1-r) but maybe I was not clear enough.This isn’t quite true. The model you posted had the direct signal arriving with half-space magnitude. Note that in the DED paper, the model uses a direct signal magnitude that is a function of listening angle (Ps=(1+cos(θ))/2).
As you already mentioned, for the DED model at 90°, the incident wave at the edge has same magnitude as free-space magnitude at same distance (or 0.5 half-space magnitude). This free-space magnitude is also what Wright found. It was calculated, measured and it seems quite logical : it cannot jump suddenly from 1 in direct field to 0 in shadow zone.
Last edited:
I think that I never gave the level of direct signal at the edge, did I ? I just gave the proportion of reflected and diffracted parts r and (1-r) but maybe I was not clear enough.
"Je Suis Charlie" from us as well.
To many angry people out there...
David
Actually…you didn’t!I think that I never gave the level of direct signal at the edge, did I ?
Sorry about that, I was looking at the image in post#51 where johnk had added it to your previously posted figure.
For thin baffles(which is my main interest for diffraction calcs), r tends to be pretty close to 0.5. As the baffle wedge angle becomes greater most of the modeling techniques say that r becomes smaller. So, the diffraction impulse seen in front of the shadow boundary should be smaller than that seen behind the shadow boundary. I’ll see if I can locate some measurements or FEA results for a box(ie wedge angle = pi/2), so we can see what the impulse magnitudes look like.All of these diagrams with r and 1-r (including your example) have the problem that they only work if r is 0.5. Any other value means the forward reflection and rearward diffraction are not the same strength. What if r is 0.3? The re-radiation doesn't balance.
Both of these examples were for thin baffles, so it makes sense that they are nearly equal.Both Wrights predictions and Vanderkooys measurements show equal strength.
Actually if you look closely at the Wright plots, the rear impulse is about 15% larger than the front.
(would be a whole lot easier to see if the Y-axis scale wasn’t so…funky)

… From the front you see the impulse from red + wave, then the delayed pulse from the blue - wave. From the rear, or any angle past 90 degrees, the two wave are coherent with no delay so what you see is a single impulse resulting from the sum of the red and blue waves.
Doesn’t this produce a rather large discontinuity(calculated) in average SPL level as you move across the shadow boundary? For angles < 90 degrees you would be summing the primary source( strength = 1) and the delayed diffraction source (strength = -0.5) resulting in an average SPL of 0dB(ie strength = 1) with oscillations above and below that level. When your reach 90 degrees, your average SPL level would suddenly jump to -6dB(ie +0.5)
The DED model smoothly adjusted the primary source strength with angle and combines with a dipole diffraction source. In my experience this more closely matches measurements for angles > 30 degrees. NOTE that I am not suggesting the concept of this model represents reality, just that its results provide a good approximation of measured data.
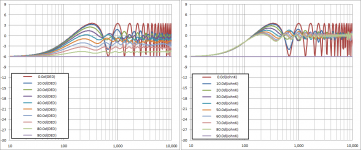
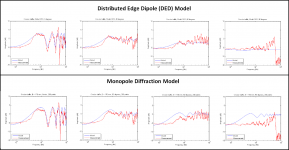
Attachment 1: Comparison between DED model and your monopole model.(point source on 1m thin baffle)
Attachment 2: Comparison of measurements to the DED model and a monopole model.(tweeter on 34cm thin baffle)
Attachments
Doesn’t this produce a rather large discontinuity(calculated) in average SPL level as you move across the shadow boundary? For angles < 90 degrees you would be summing the primary source( strength = 1) and the delayed diffraction source (strength = -0.5) resulting in an average SPL of 0dB(ie strength = 1) with oscillations above and below that level. When your reach 90 degrees, your average SPL level would suddenly jump to -6dB(ie +0.5)
The DED model smoothly adjusted the primary source strength with angle and combines with a dipole diffraction source. In my experience this more closely matches measurements for angles > 30 degrees. NOTE that I am not suggesting the concept of this model represents reality, just that its results provide a good approximation of measured data.
Attachment 1: Comparison between DED model and your monopole model.(point source on 1m thin baffle)
Attachment 2: Comparison of measurements to the DED model and a monopole model.(tweeter on 34cm thin baffle)
All I have said is that edge diffraction results in a single secondary source at the edge which has amplitude related to the strength of the surface wave arriving at the edge from the primary source, and that the resulting pressure field is the result of the vector sum of the fields radiates buy the two sources. I have not said anything about the strength of the surface wave relative to the axial response of the primary source, or its dependence on frequency. (Or if I did it was for simplicity to help make the point that diffraction is a single source). If you assume that the surface wave has a strength of A for all frequency and the diffracted wave 0.5 x A, then as you with get -6dB at DC with a baffle step like rise to a maximum of 3.5dB followed by oscillation between -6 and +3.5 as the frequency rises further. However, as you move off axis the frequency of the first peak will move higher and higher in frequency until at 90 degrees the peak will be at infinite frequency, or the 90 degree response will be uniformly -6db. There is no discontinuity at 90 degrees, just a continued shift in the first peak to higher and higher frequency. Of course that result makes no sense because it assumes the surface wave has an amplitude of A and the edge wave 0.5 x A regardless of frequency. That is reasonable at low frequency but as the frequency rises it is not. If the axial response as a magnitude of A then the surface wave will have an amplitude of A x g(f,b) and the diffracted wave will have an amplitude on the order of 0.5 x A x g(f,b) where g(f,b) is some function of frequency as well as the baffle size and shape. In reality the factor of 0.5 isn't even correct except at low frequency because it assumes an infinitely thin baffle and that the baffle edge is orthogonal to the direction of surface wave propagation.
Going back to the original argument that diffraction is a dipole source, there is no argument that the diffraction pulse seen form the front side is opposite in polarity than the pulse seen from the shadow side. The this does not mean that the secondary, diffraction source is a dipole. Note that I have used bold to emphasize the important difference between what is seen from front and rear. The pulse resulting from the diffraction of the surface wave is clearly apparent in a measurement because it is delayed from the pulse form the primary source. But the pulse from the rear is not the pulse from the diffraction source. It is the result of the sum of the two fields, that radiated from the primary source and that from the diffraction source. For practical purposes for any angle greater than 90 degrees the two fields expand as one without constructive or destructive interference.
Granted my explanation is simplified, but I see little understand of the physics wave propagation in this discussion and little reason to continue to response. Looking at specific aspects of an experimental result and concluding that something is a dipole because that aspect looks like one is not correct. What you do have is a primary source and a secondary or lower magnitude source who's radiated fields are superimposed on each other.
Your explanations are very good and help to clarify. I didn't buy into the idea of diffraction of a monopole as a dipole, but what is interesting is the effect of a true (theoretically ideal) dipole source and the response at the baffle edge. I tend to try to get a mental image of what is occurring. The response of the diffraction from a dipole, having two sides contributing to that part of the system response, would appear to be a dipole in the sense that there are two waves meeting at the edge and they are inverted from each other at that point in a fashion similar to the primary dipole before introduction of the diffraction/reflecting components.Granted my explanation is simplified, but I see little understand of the physics wave propagation in this discussion and little reason to continue to response. Looking at specific aspects of an experimental result and concluding that something is a dipole because that aspect looks like one is not correct. What you do have is a primary source and a secondary or lower magnitude source who's radiated fields are superimposed on each other.
The edge is never even a dipole in appearance, of course, since in the real world other factors come into play as has been described. But I do like the imagery, at least, for the diffraction components that originate in each sides shadow zone (i.e. the opposite side of the actual dipole source). If that makes sense as I'm describing it, that is.
Dave
Note that I am not suggesting the concept of this model represents reality, just that its results provide a good approximation of measured data.
I'm not sure that is such an important distinction. If you get to a model that seems to represent reality in all your cases, then isn't that (essentially) reality?
It seems to me that the "diffraction is an Omni source" approach is losing favor and the newer papers with better results use dipole secondary sources, or at least more complex sources.
Per Vanderkooy, "The resulting diffraction amplitude is much stronger than earlier theories, shows a strong dependence on observation angle, and changes sign on the other side of the shadow boundary."
I'm surprised that the true model of diffraction is something that is still up in the air at this point.
Where did your second group of curves come from?
David S.
It comes from http://www.torean.dk/artikel/Diffraction.pdfWhere did your second group of curves come from?
That's also surprising me.I'm surprised that the true model of diffraction is something that is still up in the air at this point.
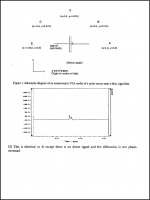
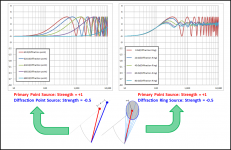
But there is still one point that is unclear for me in the DED model :
at 90°, you have a sound pressure of 0.5 half-space magnitude (or free-field magnitude).
If the reflected part come from the dipole "reflection coefficient" of 0.5, you should get (0.5 x -0.5) = -0.25 of half-space magnitude toward front direction.
From the diffracted part of back radiation, you would also get the same -0.25
But to have the usual cancellations on front axis, we need 2x -0.5 as in following picture. What's wrong in my reasoning ?

Last edited:
Yes, that is the source. Thanks for locating the website
I usually prefer to use my own measurements so I know what I have, but don't have access to them right now.
Be aware that there are a few errors in the document...for example Figures 99 & 100 don't have the correct DED results plotted for 120, 150, & 180 degrees.
Remember the DED is a "model", not necessarily a physical reality.But there is still one point that is unclear for me in the DED model :
at 90°, you have a sound pressure of 0.5 half-space magnitude (or free-field magnitude).
If the reflected part come from the dipole "reflection coefficient" of 0.5, you should get (0.5 x -0.5) = -0.25 of half-space magnitude toward front direction.
From the diffracted part of back radiation, you would also get the same -0.25
But to have the usual cancellations on front axis, we need 2x -0.5 as in following picture. What's wrong in my reasoning ?
The magnitude of the diffraction sources are not dependent on the strength of the primary source directed along the baffle toward the edge.
Instead, the magnitude of the dipole diffraction sources are set to 0.5 of the magnitude of the primary source at 0°.
The combination of these primary and diffraction sources that are functions of observation angle result in a good fit with measured data, on and off axis.
Last edited:
I guess it depends on your level of intellectual curiosity.I'm not sure that is such an important distinction. If you get to a model that seems to represent reality in all your cases, then isn't that (essentially) reality?
I am happy to have found the DED model that does a good job of predicting diffraction behavior on and off axis. But, it is frustrating that the individual pieces of the model don’t necessarily make intuitive physical sense the way the monopole diffraction model does with strength dependent on baffle surface wave. Adding Vanderkooy’s diffraction strength variation with observation angle is a big improvement, but still diverges as you approach 90 deg. I still need to try adding in the higher order diffractions(ie diffraction of the diffraction sources as seen in the Wright plots) to see how much effect they have.
Fair enough. I understand how simplification often helps make a point more clearly.… I have not said anything about the strength of the surface wave relative to the axial response of the primary source, or its dependence on frequency. (Or if I did it was for simplicity to help make the point that diffraction is a single source).
AFAIK, this is only true if you are looking at the primary point source and only 1 diffraction point source. If you put the primary point source on a circular baffle, there would be a ring of diffraction sources as you have shown on your website. In this case, the calculated response would be as described in Post#71.If you assume that the surface wave has a strength of A for all frequency and the diffracted wave 0.5 x A, then as you with get -6dB at DC with a baffle step like rise to a maximum of 3.5dB followed by oscillation between -6 and +3.5 as the frequency rises further. However, as you move off axis the frequency of the first peak will move higher and higher in frequency until at 90 degrees the peak will be at infinite frequency, or the 90 degree response will be uniformly -6db. There is no discontinuity at 90 degrees, just a continued shift in the first peak to higher and higher frequency.
(Comparison of the two cases attached below)
Am I still missing something obvious?
This description has always seemed intuitive to me and thus intellectually satisfying. However, I have yet to find a model based on this description that matches measurements for observation angles > 45 degrees. So, either the model is wrong, or a piece is missing to account for some higher order behavior of either the primary or diffraction sources.The pulse resulting from the diffraction of the surface wave is clearly apparent in a measurement because it is delayed from the pulse form the primary source. But the pulse from the rear is not the pulse from the diffraction source. It is the result of the sum of the two fields, that radiated from the primary source and that from the diffraction source. For practical purposes for any angle greater than 90 degrees the two fields expand as one without constructive or destructive interference.
Question: (this is on my list of things to measure this year)
If a point source is placed on a 1m diameter sphere and a 1m diameter thin baffle:
How would the response compare at 0°, 90°, & 180° degrees?
In particular, would you expect the impulse magnitude measured behind the sphere to be larger than for the thin baffle since there wouldn't be a diffraction source subtracting from the primary source?
Attachments
The DED model raises another question : as the diffraction model at the edge is a dipole, there is no radiation at 90°, so there should be no higher orders diffraction modes (diffraction at one edge due to diffraction on another edge). Does this fit with actual measurements ?
- Status
- This old topic is closed. If you want to reopen this topic, contact a moderator using the "Report Post" button.
- Home
- Loudspeakers
- Multi-Way
- Baffle edge diffraction with dipole radiation