Mooly, in the examples folder in LTSpice there are a few models for nonlinear transformers. The parameters for it are based on magnetic units, so theoretically anyone who could design transformers (probably not as hard as you think) could understand the model. I haven't gotten around to making sense of it though.
Unfortunately most DIY'ers are on the wrong side of transformer design and unable to properly measure transformers they use. Then there is the translation from the measurement-results into parameters...Mooly, in the examples folder in LTSpice there are a few models for nonlinear transformers. The parameters for it are based on magnetic units, so theoretically anyone who could design transformers (probably not as hard as you think) could understand the model. I haven't gotten around to making sense of it though.
And using guessed parameters in my opinion is as wrong as considering the transformer being linear...
Mooly, in the examples folder in LTSpice there are a few models for nonlinear transformers. The parameters for it are based on magnetic units, so theoretically anyone who could design transformers (probably not as hard as you think) could understand the model. I haven't gotten around to making sense of it though.
Thanks. Magnetics are way outside my field of expertise tbh. I really would be starting pretty much from zero on that.
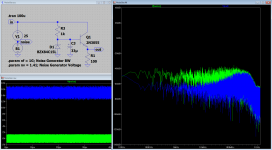
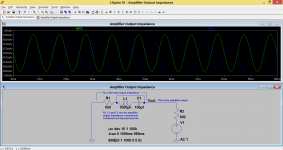
Thanks!This may be useful, look at B1 the noise voltage source")
Nice to play around with...
Thanks
I'm just trying to figure out what you have done there. I'm learning too on this.
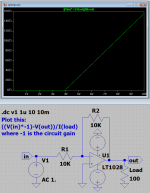
So you have a DC sweep applied that goes from 1uv to 10 volts. The output flat lines at nearly -4 volts and 40ma output due to the 100 ohm loading. Got that
How did you get the 'tohmage plot I can't see how you derive the output impedance from that tbh.
I'm just trying to figure out what you have done there. I'm learning too on this.
So you have a DC sweep applied that goes from 1uv to 10 volts. The output flat lines at nearly -4 volts and 40ma output due to the 100 ohm loading. Got that
How did you get the 'tohmage plot
I can't see how you derive the output impedance from that tbh.It's easy, if the output voltage is 9V and you are expecting 10V then the internal voltage drop (over the output impedance) is 1V, ohms law says R = V / I. This is not (but may be) the actual output impedance, so I call it virtual (you have to take into account that I am a IT guru ).
P.s. If you start at 0V then there is an divide by zero there, the 1uV is to avoid this.
).P.s. If you start at 0V then there is an divide by zero there, the 1uV is to avoid this.
Last edited:
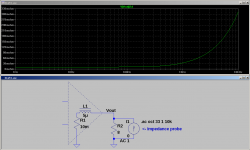
Measuring output impedance is easy and there is only one very simple way I have had to do it. Just connect a current source across the output, and make it the AC source. Then run an AC analysis and the voltage at the output will be your output impedance. You can plot V(Vout)/1A and LTSpice will write Ohms on the rulers.
EDIT: If you go to the "Waveforms" tab in the configuration you can turn on the setting to use the Omega symbol for ohms in the plots, like in FdW's plots.
EDIT: If you go to the "Waveforms" tab in the configuration you can turn on the setting to use the Omega symbol for ohms in the plots, like in FdW's plots.
Attachments
Last edited:
Thanks folks. I shall have to study all that... its easy when you know what you are doing.
@FdW, that all makes sense for the most part, its putting down as a sim that I have to really think about. I'd never done anything like adding a trace where the trace depended on a "formula" before.
@keantoken, thanks. I've figured how to get FdW's sim to run now. I would not have immediately looked in the waveforms tab for the omega symbol.
I'll have look at your circuit and set it up for myself and hopefully it will start to make sense then as a simulation.
Can anyone quickly explain why this happens.
I've been looking at simulating output impedances and confess I haven't got very far as yet. I have tried to reconcile results from LT and results calculated by hand, lol, and I 'ain't no good at calculus. It was all a long time ago
Something is bugging me in the way LT works though. Maybe I'm missing something and going cross eyed looking at all the results so I wanted to take things back to basics... and I can't understand these particular results.
Two series resistors fed by a voltage source. If I put the voltage source on the right of the diagram the voltages and two resistor currents are in phase. And so they should be

And the result of the sim,

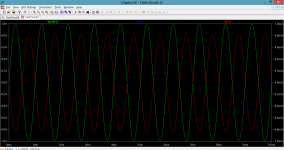
Now if I use the scissors and simply move the voltage source to the left of the diagram I find the voltage and currents out of phase.

with the result,

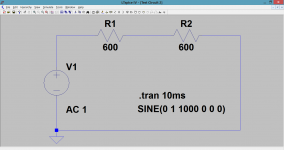
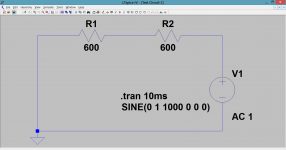
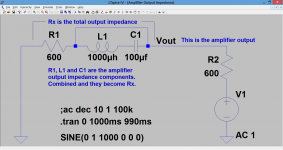
And what started all this off was this. Here are two 600 ohms in series with the cap and coil shorted. And this one gives out of phase currents for each series resistor.

How can the current in R1 and R2 be out of phase with each other ? I've included the .asc for the last one.
I feel like I'm losing the plot today with this... I'll sleep on it. Any comments as to what is going on are very welcome
I've been looking at simulating output impedances and confess I haven't got very far as yet. I have tried to reconcile results from LT and results calculated by hand, lol, and I 'ain't no good at calculus. It was all a long time ago
Something is bugging me in the way LT works though. Maybe I'm missing something and going cross eyed looking at all the results so I wanted to take things back to basics... and I can't understand these particular results.
Two series resistors fed by a voltage source. If I put the voltage source on the right of the diagram the voltages and two resistor currents are in phase. And so they should be
And the result of the sim,
Now if I use the scissors and simply move the voltage source to the left of the diagram I find the voltage and currents out of phase.
with the result,
And what started all this off was this. Here are two 600 ohms in series with the cap and coil shorted. And this one gives out of phase currents for each series resistor.
How can the current in R1 and R2 be out of phase with each other ? I've included the .asc for the last one.
I feel like I'm losing the plot today with this... I'll sleep on it. Any comments as to what is going on are very welcome
Attachments
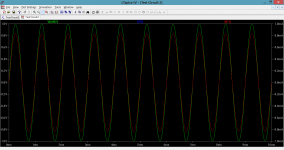
LTSpice measures current through the resistor in a direction based on the pin order of the symbol (not based on circuit voltages). The cursor symbol has an arrow that shows you which direction it measures the current (if current is flowing in the opposite direction, it will show it as negative). If it's not the right direction, flip the resistor with ctrl+E or ctrl+R (mirror and rotate).
My technique is for AC analysis only. Dynamic output impedance is something else entirely and is very hard to measure directly. Voltage loss at output could be thought of as output impedance but the actual dynamic output impedance can be anywhere depending on the design of the amplifier.
My technique is for AC analysis only. Dynamic output impedance is something else entirely and is very hard to measure directly. Voltage loss at output could be thought of as output impedance but the actual dynamic output impedance can be anywhere depending on the design of the amplifier.
Many many thanks for that.
I had absolutely no idea it behaved like that and I can't actually believe I've never noticed this before but I haven't. You could interpret that as violating Kirchhoff's first law... brilliant
Measuring output impedance is tricky with the time honoured technique of backfeeding the output from a voltage source seeming to be the most reliable method.
There is much I need to learn yet on using LT so I'll carry on with my experiments.
Thanks I think that's essentially the conventional way of measuring Zout by using a relatively high value resistor as a back feed which will approximate down to a constant current if the values are suitable.
I'm finding it less than easy to put it all into a simulation that works tbh. That's my big problem at the moment.
I think that's essentially the conventional way of measuring Zout by using a relatively high value resistor as a back feed which will approximate down to a constant current if the values are suitable. I'm finding it less than easy to put it all into a simulation that works tbh. That's my big problem at the moment.
So, my adventures thus far. Thanks to keantoken I now have the directional resistors all pointing the same way and Kirchoffs law is back on track
What I want to do is plot impedance as a graph... and I'm struggling with this. I keep saying that so much knowledge is assumed when to comes to LTSpice and this kind of reinforces that. Its all hard won at the end of the day. So how to plot a graph with ohms as the result. I looked and looked at how FdW had set his sim up and tried to do a similar thing here... with no success. I knew I wanted the 600 ohms impedance (just the two resistors) to display but how ? Having learnt that you could input what is essentially a formula and display the results wasn't working for me until I realised (lol) that you had to pick the parameters involved from the list... and not just type in what you thought you wanted. So knowing that I wanted Z to display and knowing that Z = Vout/IR2 I was trying to type that into the "expressions" box, with no luck. It was the syntax that was wrong, however... pick the values from the list (that was staring me in the face) and it works. Yea Now it all started to make a bit more sense... so far. But now I'm stuck again as you will see. I want to add the reactive components and still display the impedance as a graph with Zout in ohms.
Lets just backtrack and see how you actually do get the 600 ohms impedance to display. (And then hopefully you folks can point the way to showing how to get it all to work together)
So here is the circuit.

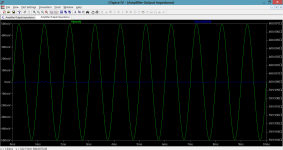
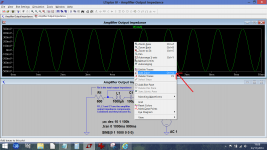
And here is how we get a display of the 600 ohms impedance... but with a problem as you will see later. So we run a "transient analysis" and get the following. Its just a divider of course and so all we see is the applied 1kHz voltage divided by 2, or 500mv.

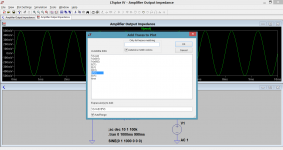
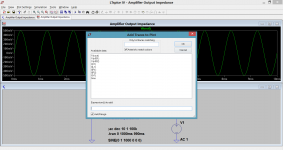
Now we are going to do something new. Right click the "plot pane" (the graph) and select "add trace".

A new box appears and this lists all the variables that are available for us to use in setting up a new trace. Notice the blank box at the bottom of the
window that says "expressions(s) to add".

We know we want Z= Vout/IR2 (the output voltage divided by current in R2) and so we now pick those from the list and just add are / (divide) sign. Having done that click OK

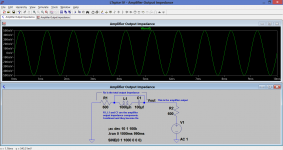
You should now see your new trace that is based on the expression Vout/IR2 appear as shown here. And of course its 600 ohms.

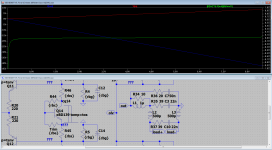
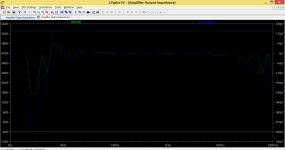
Now this is the point I'm stuck at again. I want a graph with frequency along the x axis, not time. So we can do that by running an "AC Analysis" and of course we now see our voltage (Vout) correctly shown as being -6db down due to the resistive divider.

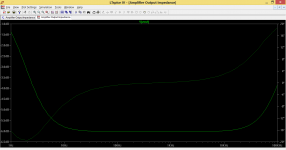
How do I get ohms to display on the Y axis ? That is what I can not fathom out at the moment. This final picture shows the two reactive components now in
circuit and the consequent output impedance curve but its shown by level (vout). How do we get that to ohms on the graph ??? It shows perfectly the rise in output impedance as the caps reactance comes into play and then the rise again at HF due to the coil.

So how is that done please ?
What I want to do is plot impedance as a graph... and I'm struggling with this. I keep saying that so much knowledge is assumed when to comes to LTSpice and this kind of reinforces that. Its all hard won at the end of the day. So how to plot a graph with ohms as the result. I looked and looked at how FdW had set his sim up and tried to do a similar thing here... with no success. I knew I wanted the 600 ohms impedance (just the two resistors) to display but how ? Having learnt that you could input what is essentially a formula and display the results wasn't working for me until I realised (lol) that you had to pick the parameters involved from the list... and not just type in what you thought you wanted. So knowing that I wanted Z to display and knowing that Z = Vout/IR2 I was trying to type that into the "expressions" box, with no luck. It was the syntax that was wrong, however... pick the values from the list (that was staring me in the face) and it works. Yea
Now it all started to make a bit more sense... so far. But now I'm stuck again as you will see. I want to add the reactive components and still display the impedance as a graph with Zout in ohms.Lets just backtrack and see how you actually do get the 600 ohms impedance to display. (And then hopefully you folks can point the way to showing how to get it all to work together
)So here is the circuit.
And here is how we get a display of the 600 ohms impedance... but with a problem as you will see later. So we run a "transient analysis" and get the following. Its just a divider of course and so all we see is the applied 1kHz voltage divided by 2, or 500mv.
Now we are going to do something new. Right click the "plot pane" (the graph) and select "add trace".
A new box appears and this lists all the variables that are available for us to use in setting up a new trace. Notice the blank box at the bottom of the
window that says "expressions(s) to add".
We know we want Z= Vout/IR2 (the output voltage divided by current in R2) and so we now pick those from the list and just add are / (divide) sign. Having done that click OK
You should now see your new trace that is based on the expression Vout/IR2 appear as shown here. And of course its 600 ohms.
Now this is the point I'm stuck at again. I want a graph with frequency along the x axis, not time. So we can do that by running an "AC Analysis" and of course we now see our voltage (Vout) correctly shown as being -6db down due to the resistive divider.
How do I get ohms to display on the Y axis ? That is what I can not fathom out at the moment. This final picture shows the two reactive components now in
circuit and the consequent output impedance curve but its shown by level (vout). How do we get that to ohms on the graph ??? It shows perfectly the rise in output impedance as the caps reactance comes into play and then the rise again at HF due to the coil.
So how is that done please ?
Attachments
-
 Impedance Curve.PNG30.4 KB · Views: 121
 -
 Analysis 1.PNG33.7 KB · Views: 115
 -
 600 ohm Impedance.PNG60.5 KB · Views: 125
 -
 Add Expressions.PNG51.5 KB · Views: 113
 -
 Add Trace 2.PNG51.3 KB · Views: 108
 -
 Add Trace.png201.8 KB · Views: 109
 -
 Impedance Tran 1.PNG57 KB · Views: 111
 -
 Amplifier Output Impedance.PNG49.1 KB · Views: 113
 -
Amplifier Output Impedance.asc1.3 KB · Views: 87
- Home
- Design & Build
- Software Tools
- Installing and using LTspice IV (now including LTXVII), From beginner to advanced