I'm not so sure about that anymore. Our hearing is tremendously complex and physical concepts like "direct sound" don't seem to fit. Especially when we're talking about listening in enclosed spaces.
Actually I do take the complexity of our hearing into account. Localization que's are still the same, it's only when we add the complexity of the baffle, diffraction, phase shift irregularities, power/polar response, gross group delay and the room to name a few to fix this M³ (man made mess) we've created.
I'm not so sure about that anymore. Our hearing is tremendously complex and physical concepts like "direct sound" don't seem to fit. Especially when we're talking about listening in enclosed spaces.
Its the complexity (or sophistication) that makes it work, that allows the brain to focus in on the early sound and downplay the later sound. Read the various studies on the subject, especially Kates who explains the phenomonon in terms of ear brain processing.
David S
Its the complexity (or sophistication) that makes it work, that allows the brain to focus in on the early sound and downplay the later sound. Read the various studies on the subject, especially Kates who explains the phenomonon in terms of ear brain processing.
David S
From reading Welcome | Auditory Neuroscience things don't look that simplistic to me anymore.
Last edited:
I've tried to use the blender .xls with a 8" full range driver. Unfortunately the near field and windowed response don't show much similarity in the blending region (200-600Hz). How to approach this?
I've attached near field and windowed response. The windowed response was measured in 1m distance and is gated after 3.5ms.
I've attached near field and windowed response. The windowed response was measured in 1m distance and is gated after 3.5ms.
Attachments
From reading Welcome | Auditory Neuroscience things don't look that simplistic to me anymore.
That is interesting.
Its the complexity (or sophistication) that makes it work, that allows the brain to focus in on the early sound and downplay the later sound. Read the various studies on the subject, especially Kates who explains the phenomonon in terms of ear brain processing.
The Soren Bech studies are pretty good for this. He looked at the audibility of all the expected reflections in a typical listening room and found that outside of the floor bounce in front of a speaker and (rarely) the back wall and side wall first bounce that no later bounces were individually audible. Based on that it is safe to say that changing the level or frequency response of energy going in directions away from the listener are inconsequential as long as the level stays below those typical thresholds.
David S
I think Speaker Dave is correct when it comes to enjoying listening to your audio system. You can over analyze anything but not show where it affects listening enjoyment.
^
Aaah, SciencetologyThey just don't provide all the data I'm interested in.
Psedo-science doesn't provide valid data.....at all.
OK, It all depends on the room. That is the answer satisfying or not. Not all questions will have "satisfying" answers. That's why there is religion. They always have "the answers". You just have to accept them on faith. You could try that.
I agree with Gedlee but also want to point out that "religion" seems to play a large role for some audiophiles who think that power cords, cables and magic tweaks make their system sound better. They should look into religion for their own personal benifit instead of worshipping at the altar of "I Always Hear Differences in EVERY Audio Component" I feel that some audiophiles substitute their obsession with audio components for not having any sort of religious belief system. Sounds silly? People have to have something to believe in.
Last edited:
I've tried to use the blender .xls with a 8" full range driver. Unfortunately the near field and windowed response don't show much similarity in the blending region (200-600Hz). How to approach this?
I've attached near field and windowed response. The windowed response was measured in 1m distance and is gated after 3.5ms.
First Question:
Have you included the diffraction (baffle step loss) data? This has to be added to the nearfield measurement before trying to blend it with the far-field data. This is because a true the nearfield measurement does not include the baffle step response, but the farfield does, so in order to get them to line up for blending you need to add on the baffle step response, obtained from a model, to the nearfield. There is a built in baffle step modeler in the Blender, or you can use an external program, write the model data to an FRD file, and then import that into the Blender.
Second Question:
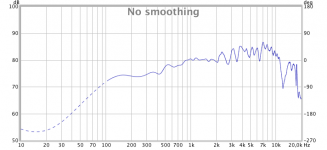
How close was the microphone to the driver dustcap or cone when you measured the nearfield response? The nearfield response shows a dip around 300Hz which I would not expect to be there unless the microphone was some distance away or some other factor caused a cancellation at that frequency. For a nearfield measurement the microphone should be no farther than 1cm away from the radiating surface for an 8in driver.
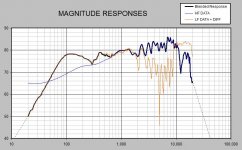
I imported your data into the Blender. I was able to get the windowed and nearfield responses to lie more or less on top of each other where I would blend them (between 500Hz and 1000Hz). To do this I had to entered -9 in cell B25. This value is added to the low frequency data. The idea is that the farfield data has the correct SPL level and you need to move the nearfield response up or down in SPL to match it. I uploaded a pic below taken from the blender to show you the result.
I hope that helps. Feel free to post more questions or problems and I will try to help, or you can contact me directly.
-Charlie
Attachments
Markus
I think that you have highlighted an issue that I was concerned about. By blending from 500 - 1000 Hz, the final result could contain near field problems that would not appear in the far field. The large hole at 300 Hz is a classic issue. It does not appear in the ground plane results. I don't think that it is really there.
I think that you have highlighted an issue that I was concerned about. By blending from 500 - 1000 Hz, the final result could contain near field problems that would not appear in the far field. The large hole at 300 Hz is a classic issue. It does not appear in the ground plane results. I don't think that it is really there.
I agree with Earl. I think that your nearfield measurement is suspect. That's not the only way to create low frequency data for the blender. I suggest that you instead measure the Thiele-Small parameters for the driver and use a box modeler to create the response. If you use Woofer Box and Circuit Designer you can export theTS model response as an FRD file. You then import that into the Blender as the low frequency data set and add the diffraction model to that, just like you would do with nearfield data.
Does the driver have a whizzer cone? I am curious what might be causing the nearfield to have that dip at 300Hz. Any ideas?
Does the driver have a whizzer cone? I am curious what might be causing the nearfield to have that dip at 300Hz. Any ideas?
Markus
I think that you have highlighted an issue that I was concerned about. By blending from 500 - 1000 Hz, the final result could contain near field problems that would not appear in the far field. The large hole at 300 Hz is a classic issue. It does not appear in the ground plane results. I don't think that it is really there.
The ground plane measurement is gated at 8,7ms so there are not enough data points that would reliably show the hole.
What would be the explanation for such a hole showing up in a near field measurement if it's not really there?
Last edited:
Does the driver have a whizzer cone? I am curious what might be causing the nearfield to have that dip at 300Hz. Any ideas?
No whizzer cone. The driver is a Visaton B200. Here're the specs:
B 200 - 6 Ohm
Could there be something about 30cm away that is causing a reflection that is picked up in the nearfield? How about the back of the cabinet? 30cm is about a 1/4 wavelength at 300Hz. The reflected wave would return to the front 180 degrees out of phase and could cause cancellation that results in a dip. This just a guess on my part - you could try doing another nearfield measurement with an open back type mounting to see if the dip goes away.
Markus
I think that you have highlighted an issue that I was concerned about. By blending from 500 - 1000 Hz, the final result could contain near field problems that would not appear in the far field. The large hole at 300 Hz is a classic issue. It does not appear in the ground plane results. I don't think that it is really there.
???
Is this not floor/ceiling bounce null? Correlates well with all the measurements and room testing I've done.
???
Is this not floor/ceiling bounce null? Correlates well with all the measurements and room testing I've done.
I has to be something about 1/4 wavelength away, so it could possibly be the floor. At that distance (30cm/12") the relative strength of the reflection compared to the cone might still be strong enough to cause interference. Usually boundaries that are farther away have reflected signals that are so much lower in intensity compared to the direct sound that they do not really show up in the signal. Remember that the microphone is very, very close to the diaphragm for the nearfield measurement.
I has to be something about 1/4 wavelength away, so it could possibly be the floor. At that distance (30cm/12") the relative strength of the reflection compared to the cone might still be strong enough to cause interference. Usually boundaries that are farther away have reflected signals that are so much lower in intensity compared to the direct sound that they do not really show up in the signal. Remember that the microphone is very, very close to the diaphragm for the nearfield measurement.
True, but we're splicing nearfield to farfield. A properly designed 2.5way goes a long way to reduce this null as the two drivers at different floor bounce positions create two nulls that shift lower with distance, but one covers the other to reduce what they each produce. Same thing as room modes, with proper sub placement can mostly correct. Just another PITA "cause and effect" thing to deal with.
One of the things I found interesting in modeling with edge is the baffle itself and the effect it has, Yes Olson, but more to detail. A taller enclosure front baffle induces a bounce all of its own due to length, which is then compounded by the floor. If I'm not mistaken this is a surface wave induced issue. For example a typical two way floor stander. If this lower enclosure is but nothing more than a stand to raise the drivers height then a null is created. If this where raised with an open base this null can be mostly corrected for. Is no different than correcting for edge diffraction at higher frequencies for a given baffle width or driver placement, especially if we are to use driver offset. Earl has taken the high road on this keeping a axisymmetric layout, minimizing issue. To look at how tall the enclosure is probably the answer for the anechoic simulation variance seeing that we are looking at ground plane freefield (no floor bounce in range of interest) and nearfield where the direct level grossly outweighs the farfield to be of no significance. Perhaps if measured at the event horizon between that sliding nearfield to farfield distance vs freq we can see this more clearly.
Markus
I think that you have highlighted an issue that I was concerned about. By blending from 500 - 1000 Hz, the final result could contain near field problems that would not appear in the far field. The large hole at 300 Hz is a classic issue. It does not appear in the ground plane results. I don't think that it is really there.
Well, first I don't think anyone is advocating splicing in the 500 - 1000 Hz range. It's just used to assist is aligning responses, but even then, that's a bit higher than I would recommend even for that.
Second, how does close-mic'ing the response result in a hole at 300Hz? Nothing at this wavelength should interact with the a mic a few millimeters from the dustcap, unless this is a REALLY large driver. Or unless reflections are close to the same magnitude as the near-field response, but that would be odd given the proximity of the mic to cone. I agree with you that it likely isn't real and won't show up in the far-field, but I usually only see nulls like this above 1000 Hz even with 12" woofers. 300 Hz seems quite odd for a null using this measurement method.
If the mic is placed in the center of the speaker only a few millimeters away from the dustcap / cone you should get a much cleaner looking response plot than one posted above. Something doesn't look right to me.
Last edited:
- Status
- This old topic is closed. If you want to reopen this topic, contact a moderator using the "Report Post" button.
- Home
- Loudspeakers
- Multi-Way
- Nearfield/Farfield curve splicing