A few experients to see if they made a difference... changing source gen Zo and the like has not had any affect on the harmonic structure seen from the monitor port.
Now I am down to thinking the DSP algorithms and filters are different.... for example, Blackman-Harris vs Rectangular vs Hanning, Hamming. What ever it is, it is fixed and I cant change it. And, it does affect the THD result I get with different hardware analyzers which use DSP/software/firmware filtering internally. I can get 6-8dB differences between instruments on 3H when near the -120dB THD levels. That is trouble-some and unexpected.
Thx-RNMarsh
Last edited:
Maybe, that wasnt it. using two different source generators, I get different harmonic results between two seperate analyzersMight it be different source Z interacting with analyzer inputs circuits? Gotta check it more.
-RNM
Hi Rick,
You're trying to explain non linear distortion with linear reasoning. This won't work.
Linear distortions are the ones most easily identified and trimmed out because we can easily measure them.
A few experients to see if they made a difference... changing source gen Zo and the like has not had any affect on the harmonic structure seen from the monitor port.
Now I am down to thinking the DSP algorithms and filters are different.... for example, Blackman-Harris vs Rectangular vs Hanning, Hamming. What ever it is, it is fixed and I cant change it. And, it does affect the THD result I get with different hardware analyzers which use DSP/software/firmware filtering internally. I can get 6-8dB differences between instruments on 3H when near the -120dB THD levels. That is trouble-some and unexpected.
Thx-RNMarsh
The Shibasoku doesn't used DSP as we think of it for the harmonic analysis. Its a different sampling based solution. If you are looking at the monitor out with an FFT you need to make sure the fundamental is centered on a bin or the readings can get altered by spilling into adjacent bins. The QA400 allows you to set its source to a bin. I set the external generator to that frequency (a good counter helps) to work around this issue. From what I have seen the autonull/autotune are the big culprits on the 2nd and 3rd harmonic generation. Somehow the 725 avoids them or at least not in the first and second stage nulling.
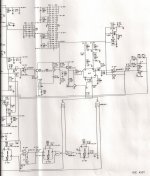
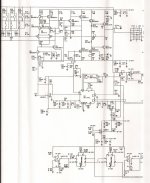
I think several of us will want a scan of the Panasonic manual.
same source-different data-different analyzer
I am not using FFT on monitor output... that would Really complicate things. Just the slow swept analog filter (Spect analyzer). Here's a thousand words:
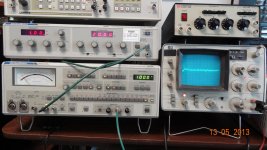
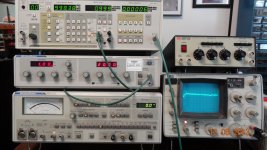
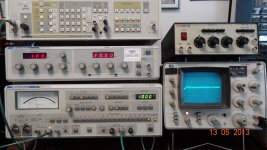
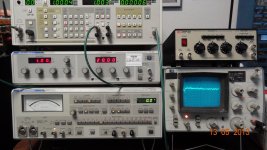
Never mind what the absolute levels are - each analyzer is at their lowest range - but zoom in and look at the 2H and 3H levels and to each other.
Clearly the 725 shows more harmonics with lower noise floor. But those harmonics displayed are not even remotely close to one-another.
Thx-RNMarsh
I am not using FFT on monitor output... that would Really complicate things. Just the slow swept analog filter (Spect analyzer). Here's a thousand words:


Never mind what the absolute levels are - each analyzer is at their lowest range - but zoom in and look at the 2H and 3H levels and to each other.
Clearly the 725 shows more harmonics with lower noise floor. But those harmonics displayed are not even remotely close to one-another.
Thx-RNMarsh
Last edited:
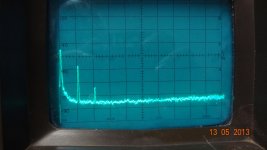
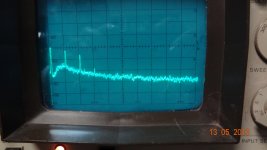
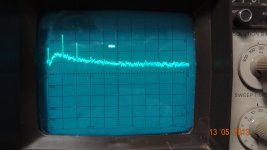
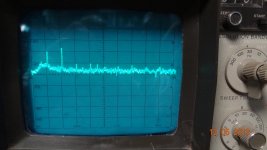
Harmonic spectrum from 4 different analyzers' monitor ouput.... each driven by a 10Vac rms signal from ShibaSoku AG16B (THD well below .0001%). Previous photo's were with 1v input. Each analyzer has auto scaling/ranging or manual range change to normalize the input level to the analyzer.
10dB/div;
339A(mod.), 7723A, 7722A, 725D
Thx-RNMarsh
10dB/div;
339A(mod.), 7723A, 7722A, 725D


Thx-RNMarsh
Last edited:
Harmonic spectrum from 4 different analyzers' monitor ouput.... each driven by a 10Vac rms signal from ShibaSoku AG16B (THD well below .0001%). Previous photo's were with 1v input. Each analyzer has auto scaling/ranging or manual range change to normalize the input level to the analyzer.
10dB/div;
Thx-RNMarsh
Dick,
There are a few approaches to this issue.
The first is what I call eBay reciprocity calibration. You buy three of the same units and try them all. If they all read the same then you resell two of them as calibrated! If one reads differently you fix it and then sell it.
The second method you are more likely to try is injection lock through an RC network a second oscillator to the test oscillator and see how the analyzers handle more or less second and third.
I suspect what you are seeing is a bit of ringing or overshoot on some of the filters. It could be noise. So try injecting a bit of noise into the signal to see how things move.
Of course if what you are using the analyzers for is a better or worse comparison then absolute calibration is not required.
ES
It would help a lot to separate the generator distortion from the analyzer distortion. I would try inserting the B&K passive filter (-20 dB distortion analyzer mode) between the source and the 725D. Use the B&K notch to reduce the fundamental 40 dB and go into the 30 mV input. This should "amplify" the generator harmonics by 40 dB. You can then easily see if the harmonic pattern has changed and what the relative levels are. I think its pretty safe to assume the components in the B&K will introduce less than -140 dB distortion, they all seem to be very high quality.
I'm still not sure how an FFT analyzer would complicate the harmonic measurements. But I have been the technology for years.
I'm still not sure how an FFT analyzer would complicate the harmonic measurements. But I have been the technology for years.
I think several of us will want a scan of the Panasonic manual.
Too many pages..... which part is of interest?
-RNM
At a minimum schematics of the oscillator and the analyzer showing multiplier solutions and input circuitry.
Same.
Can you get them into PDF?
If we need more that can't be dealt with later.
It would help a lot to separate the generator distortion from the analyzer distortion. I would try inserting the B&K passive filter (-20 dB distortion analyzer mode) between the source and the 725D. Use the B&K notch to reduce the fundamental 40 dB and go into the 30 mV input. .
None of the THD analyzers I tried this on will function with that low of a fundamental input level.
-RNM
None of the THD analyzers I tried this on will function with that low of a fundamental input level.
-RNM
Try stepping the input voltage up a bit at a time and then notch the fundamental.
get tit to the minimum the analyzer will function with.
I am not using FFT on monitor output... that would Really complicate things. Just the slow swept analog filter (Spect analyzer). Here's a thousand words:
View attachment 348310
View attachment 348311
View attachment 348312
View attachment 348313
Never mind what the absolute levels are - each analyzer is at their lowest range - but zoom in and look at the 2H and 3H levels and to each other.
Clearly the 725 shows more harmonics with lower noise floor. But those harmonics displayed are not even remotely close to one-another.
Thx-RNMarsh
Hi Richard,
Nice stack of equipment!
I continue to be impressed by this excellent thread.
I also have a 339A, but have not used it as much as I should. I seem to have gotten under the impression that, overall, the 339A oscillator plus analyzer, back-to-back, was not as good as my own THD analyzer. Maybe the stock HP is simply not doing as well as it should be. My analyzer does about 0.0008% out to 20kHz in a 200kHz measurement bandwidth. Not sure which dominates, the oscillator or the analyzer.
I should probably do the oscillator of one with the analyzer of the other and vice versa.
Maybe I missed it, but has there been much evaluation here of oscillators/analyzers at significantly higher frequencies than 1kHz? What I'm thinking of is probably a fundamental of 16kHz, so one can see at least out to the 3rd harmonic on an HP3580A.
Cheers,
Bob
Now that I and you and all the many others before me are focused at harmonic levels well below -100dB (<-120db re 1v), these little spurious artifacts are being found and eliminated, one by one. Parts, topologies, circuits and osc and analyzer are being cleaned up or finding work-arounds.
Can you help to suggest how we can seperate where the harmonics are coming from - source or analyzer or thier interaction?
[1Khz is just convenient for comparison purposes.... eventually when thngs get better understood and cleaned up, we can apply what we learn to all freq of use for testing]
Thx-RM
Last edited:
Now that I've - and you and all the many others before me - are focused at harmonic levels below -120db re 1v, these little spurious artifacts are being found and eliminated, one by one. Parts, topologies, circuits and osc and analyzer are being cleaned up or finding work-arounds.
Can you help to suggest how we can seperate where the harmonics are coming from - source or analyzer or thier interaction?
Thx-RM
If you put a 6dB pad between the oscillator and the analyzer (assuming the pad and interface are always 600 ohms), then the 2nd harmonic should go down by 6dB if is coming from the analyzer in most cases, where the working level in the analyzer is determining its distortion (not sure this will apply to the control voltage ripple contribution, however). If the 2nd harmonic stays the same, it is probably from the oscillator. This is just a rough test and there may be exceptions.
For the 3rd, distortion should theoretically go down by 12dB if the dominant source of distortion is in the analyzer. Above caveats apply.
In both these tests, we assume anayzer input attenuator remains the same. We also assume that the 2nd and 3rd are measured with a spectrum analyzer at the residual output with sufficiently narrow bandwidth that noise will not influence the result.
Just my suggestion. There are probably plenty of other possible ways to try to separate these out.
BTW, if you suspect the source might be the control device or agc control signal in the oscillator, you can usually temporarily make one of these worse (or better) to see if it makes a difference in the 2nd or 3rd. For the control element, increase its authority or screw up the gate feedback level if it is a JFET and see if the distortion increases. For the agc control voltage ripple, temporarily increase or decrease the filtering and see what happens.
Cheers,
Bob
- Home
- Design & Build
- Equipment & Tools
- Low-distortion Audio-range Oscillator
