

Integration and test of CS4398 / PIC based Direct Digital Synthesiser
Posted 2nd November 2014 at 05:03 AM by googlyone
Updated 2nd November 2014 at 10:48 AM by googlyone
Updated 2nd November 2014 at 10:48 AM by googlyone
About 6 months ago I finished off a CS4398 (DAC) and PIC32MX450 (microcontroller) based direct Digital Synthesiser.
I recently packaged this into an instrument case, and added a power supply cum interface card that allows this to all neatly plug together. As a final chapter to the development of this synth, I have tried to measure the harmonics it generates and to use it to test an example amplifier.
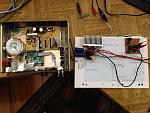
What does it look like? Not super fancy, but neat enough and laid out pretty reasonably I think:
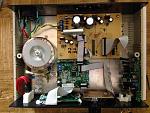
The larger home made board at the back is a power supply - well five of them in fact - to allow clear isolation between a number of digital and analogue rails.
The square board on the base of the case is the PIC board. This runs the human machine interface and more importantly does all the calculation of the waveforms. You can generate any waveform you want, provided it is repetitive and can be described in the memory of the PIC, which is actually fairly generous. The system does interpolation between these points allowing a significant increase in quantisation precision for waveform generation.
How to test this? Initial tests were done by plugging my sound card onto the DDS and seeing what I measured. I knew at the time that I would probably be measuring the sound card just as much as the DDS, however without undertaking some serious stuffing around, what else to do?
I now have the time to invest in some tests...
The issue:
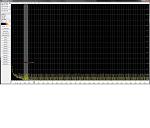
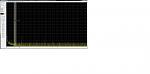
This is the spectra of the DDS driven straight into the sound card:
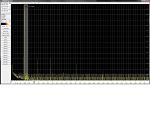
-100dB.... not too bad. but is it real? Is it the sound card? The answer is a bit of both.
The trick is to recognise that the majority of the contribution the sound card makes comes from harmonics of the fundamental. In this case 567Hz. (one of three arbitrary frequencies at which I chose to test the DDS)
If you filter out the fundamental, at least to the point of reducing it significantly, then the contribution of the sound card will fall commensurately. (depending on the order product you are looking at it will fall at a multiple of the attenuation you apply to the fundamental signal).
The filtering approach I chose was simple - a passive Twin T notch filter. Look it up on the net, there is plenty there.
The simplest implementation is purely passive. Putting the Twin T into the feedback loop of an op amp allows a massive increase in Q, but comes at the price of:
a. Active parts, which can themselves introduce noise and more importantly power and grounding issues, and
b. A high Q filter is a bugger to tune and keep tuned.
The passive filter though:
a. Means that you need to understand that there will be about 10dB attenuation to the second harmonic, 3dB attenuation tot he 3rd and 4th and a couple of dB to the 5th harmonic. I can live with that. You need to apply these as corrections to the measured harmonics.
b. I can be pretty sure that some film capacitors and metal film resistors won't add too much distortion though!
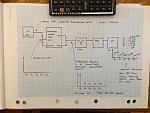
What is the setup?
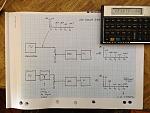
At the top is the direct measurement jig.
At the bottom is the connection to allow the fundamental to be filtered out. The actual filter I built was simply a piece of veroboard and some very carefully matched bits soldered to it.
In retrospect, I ought to have mounted this in a metal enclosure, as you will later see the effect of the increased impedance and ack of shielding to the 50Hz noise that pervades my house.
A benefit of using a set of fixed frequency filters and DDS is that the drift is pretty low for the really sensitive parts of the test setup. The depth of notch I achieved, without fine tuning the components other than selecting them very carefully, was 55dB.
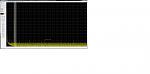
The spectra of the DDS with filter in place is below.
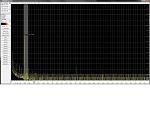
The 50Hz hash down low is a result of the lack of shielding on the test setup and the increased impedance compared to the DDS direct output at low frequencies. If you refer above to the DDS direct output the 50Hz line is way down, and harmonics of this in the noise.
But how did the harmonics from the DDS output fare?
All but the 5th and 7th harmonic are below the -125dB noise floor. I ran linearity tests on the card and attenuated the DDS output from 0dB to 120dB, and the sound card tracked this to within a dB or so, so the dynamic range of the sound card is doing just fine.
It would be fair to say that the 2nd harmonic is less than -115dB (remember the 10dB attenuation of the H2), 3rd harmonic below -120dB and so forth.
This equates to the oscillator (in terms of harmonics only) producing 0.0002% or so. I won't argue the exactness of this, but will take heart that the level is right down there.
How dies the sound card go by itself? Not too bad when the input is shorted. I don't need to be wildly worried about noise.
OK, so this looks like it could really be a useful input to test an amp. I pulled out a power op am than I built a few years ago. This thing is essentially a "blameless Self" implementation using a heap of SMT devices and some really crappy TIP41C / TIP42C output devices.
The test setup is:
A few things to be careful of:
-1- The oscillator output level is NOT CHANGED from that used to characterise oscillator distortion as previously discussed.
-2- A passive attenuator is used on the input to the amplifier to set the level to near clipping.
-3- A passive attenuator is used on the amplifier output to reduce the signal level to very close to that used to characterise oscillator distortion as previously discussed.
I.e. between the attenuators, the amplifier "drops into" the test setup, with all levels remaining identical.
The setup is not wildly beautiful.
What did I measure?
-1- Raw measurement with filter, but no load on amplifier

Fiddling with the wiring (alligator clips - which is probably not optimal) showed some sensitivity of spurs, but in general the only significant measurement was H3 at about -120dBc.
Not really a useful test for a power amp - even a tiny one.
-2- With notch filter in place and 8R load on amplifier
Ahhh that is more realistic. So what do we see?
Fo = -55dBc
H2 = -108dBc
H3 = -124dBc
H4 = -115dBc
H5 = -114dBc
The fundamental was actually about -2dBC, so the corrections for these are:
Fo = -55dBc ------
H2 = -108dBc +10 + 2 = -96dBc
H3 = -124dBc + 3 + 2 = -119dBc
H4 = -115dBc + 3 + 2 = -110dBc
H5 = -114dBc + 2 + 2 = -110dBc
This is dominated by H2, and will be very close to 0.002%.
This is:
-1- An order of magnitude larger than the distortion measured from the oscillator itself, and also a different harmonic is the highest.
-2- About what you would expect of this amplifier given the pretty lashed up setup.
Conclusions:
-1- The oscillator works, and will be useful for distortion and other tests.
-2- The Twin T notch filter works, and whilst a fixed implementation (I did 3 of them), is limiting, it gives good insight into what the amplifier is doing.
-3- notching the fundamental allows a very useful analysis of the spectrum using a low cost sound card.
-4- The sampling rate of the sound card, in this case 192Ks/s will be a limitation on the upper frequency that can be usefully tested.
-5- There is a bit of stuffing around required to work out whether you are measuring the test setup, the unit under test, the flourescent light on the bench or the cat on the chair next to you. This will always be the case when you are looking for signals WAAAAY down in the noise.
PS:
- All FFT stuff was done at 192Ks/s, 24 Bit, 512000 samples in the block of data and Hanning window. I used four times averaging.
- I used SpectrumLab as the tool for this, and had to explicitly shut down the internal test oscillator, and this was generating -110dBc crosstalk from the DAC into the ADC.
- The sound card was a simple USB Creative X-Fi Audio job.
I recently packaged this into an instrument case, and added a power supply cum interface card that allows this to all neatly plug together. As a final chapter to the development of this synth, I have tried to measure the harmonics it generates and to use it to test an example amplifier.
What does it look like? Not super fancy, but neat enough and laid out pretty reasonably I think:

The larger home made board at the back is a power supply - well five of them in fact - to allow clear isolation between a number of digital and analogue rails.
The square board on the base of the case is the PIC board. This runs the human machine interface and more importantly does all the calculation of the waveforms. You can generate any waveform you want, provided it is repetitive and can be described in the memory of the PIC, which is actually fairly generous. The system does interpolation between these points allowing a significant increase in quantisation precision for waveform generation.
How to test this? Initial tests were done by plugging my sound card onto the DDS and seeing what I measured. I knew at the time that I would probably be measuring the sound card just as much as the DDS, however without undertaking some serious stuffing around, what else to do?
I now have the time to invest in some tests...
The issue:
This is the spectra of the DDS driven straight into the sound card:

-100dB.... not too bad. but is it real? Is it the sound card? The answer is a bit of both.
The trick is to recognise that the majority of the contribution the sound card makes comes from harmonics of the fundamental. In this case 567Hz. (one of three arbitrary frequencies at which I chose to test the DDS)
If you filter out the fundamental, at least to the point of reducing it significantly, then the contribution of the sound card will fall commensurately. (depending on the order product you are looking at it will fall at a multiple of the attenuation you apply to the fundamental signal).
The filtering approach I chose was simple - a passive Twin T notch filter. Look it up on the net, there is plenty there.
The simplest implementation is purely passive. Putting the Twin T into the feedback loop of an op amp allows a massive increase in Q, but comes at the price of:
a. Active parts, which can themselves introduce noise and more importantly power and grounding issues, and
b. A high Q filter is a bugger to tune and keep tuned.
The passive filter though:
a. Means that you need to understand that there will be about 10dB attenuation to the second harmonic, 3dB attenuation tot he 3rd and 4th and a couple of dB to the 5th harmonic. I can live with that. You need to apply these as corrections to the measured harmonics.
b. I can be pretty sure that some film capacitors and metal film resistors won't add too much distortion though!
What is the setup?

At the top is the direct measurement jig.
At the bottom is the connection to allow the fundamental to be filtered out. The actual filter I built was simply a piece of veroboard and some very carefully matched bits soldered to it.
In retrospect, I ought to have mounted this in a metal enclosure, as you will later see the effect of the increased impedance and ack of shielding to the 50Hz noise that pervades my house.
A benefit of using a set of fixed frequency filters and DDS is that the drift is pretty low for the really sensitive parts of the test setup. The depth of notch I achieved, without fine tuning the components other than selecting them very carefully, was 55dB.
The spectra of the DDS with filter in place is below.

The 50Hz hash down low is a result of the lack of shielding on the test setup and the increased impedance compared to the DDS direct output at low frequencies. If you refer above to the DDS direct output the 50Hz line is way down, and harmonics of this in the noise.
But how did the harmonics from the DDS output fare?
All but the 5th and 7th harmonic are below the -125dB noise floor. I ran linearity tests on the card and attenuated the DDS output from 0dB to 120dB, and the sound card tracked this to within a dB or so, so the dynamic range of the sound card is doing just fine.
It would be fair to say that the 2nd harmonic is less than -115dB (remember the 10dB attenuation of the H2), 3rd harmonic below -120dB and so forth.
This equates to the oscillator (in terms of harmonics only) producing 0.0002% or so. I won't argue the exactness of this, but will take heart that the level is right down there.
How dies the sound card go by itself? Not too bad when the input is shorted. I don't need to be wildly worried about noise.

OK, so this looks like it could really be a useful input to test an amp. I pulled out a power op am than I built a few years ago. This thing is essentially a "blameless Self" implementation using a heap of SMT devices and some really crappy TIP41C / TIP42C output devices.
The test setup is:

A few things to be careful of:
-1- The oscillator output level is NOT CHANGED from that used to characterise oscillator distortion as previously discussed.
-2- A passive attenuator is used on the input to the amplifier to set the level to near clipping.
-3- A passive attenuator is used on the amplifier output to reduce the signal level to very close to that used to characterise oscillator distortion as previously discussed.
I.e. between the attenuators, the amplifier "drops into" the test setup, with all levels remaining identical.
The setup is not wildly beautiful.

What did I measure?
-1- Raw measurement with filter, but no load on amplifier


Fiddling with the wiring (alligator clips - which is probably not optimal) showed some sensitivity of spurs, but in general the only significant measurement was H3 at about -120dBc.
Not really a useful test for a power amp - even a tiny one.
-2- With notch filter in place and 8R load on amplifier

Ahhh that is more realistic. So what do we see?
Fo = -55dBc
H2 = -108dBc
H3 = -124dBc
H4 = -115dBc
H5 = -114dBc
The fundamental was actually about -2dBC, so the corrections for these are:
Fo = -55dBc ------
H2 = -108dBc +10 + 2 = -96dBc
H3 = -124dBc + 3 + 2 = -119dBc
H4 = -115dBc + 3 + 2 = -110dBc
H5 = -114dBc + 2 + 2 = -110dBc
This is dominated by H2, and will be very close to 0.002%.
This is:
-1- An order of magnitude larger than the distortion measured from the oscillator itself, and also a different harmonic is the highest.
-2- About what you would expect of this amplifier given the pretty lashed up setup.
Conclusions:
-1- The oscillator works, and will be useful for distortion and other tests.
-2- The Twin T notch filter works, and whilst a fixed implementation (I did 3 of them), is limiting, it gives good insight into what the amplifier is doing.
-3- notching the fundamental allows a very useful analysis of the spectrum using a low cost sound card.
-4- The sampling rate of the sound card, in this case 192Ks/s will be a limitation on the upper frequency that can be usefully tested.
-5- There is a bit of stuffing around required to work out whether you are measuring the test setup, the unit under test, the flourescent light on the bench or the cat on the chair next to you. This will always be the case when you are looking for signals WAAAAY down in the noise.
PS:
- All FFT stuff was done at 192Ks/s, 24 Bit, 512000 samples in the block of data and Hanning window. I used four times averaging.
- I used SpectrumLab as the tool for this, and had to explicitly shut down the internal test oscillator, and this was generating -110dBc crosstalk from the DAC into the ADC.
- The sound card was a simple USB Creative X-Fi Audio job.
Total Comments 0


