The more I look at that rolled off HF on the QUAD from Stereophile, the more I am convinced it is bad data.... did not remove room reflections from the data before processing.
Examples show this...... see direct sound (a) and effect of reflections on it (b):

THx-RNMarsh
Examples show this...... see direct sound (a) and effect of reflections on it (b):
THx-RNMarsh
Last edited:
Demian,Here are several superimposed impedance plots.
The taller one is at a 10 db higher drive level. the lower drive level plots are with bias on and bias off. I could only turn up the AC to about 40% before the discharge internally became excessive. As such the clamp circuit was not powered and shutting everything down at any higher drive level.
I think the drive levels are around 10V and 3V. The annoying ticking from the bad panel persuaded me to stop pretty quickly.
There really is no difference bias on and bias off. There is some difference related to drive level in the LF resonance.
This speaker is too sick to do much more testing until the dead panel is replaced.
Great that you already found the time to do some measuring.
Does the Yellow phase curve apply to the Blue Impedance curve taken at around 10V ?
Then you mention Bias on and Bias off.
Do I understand it correctly that Red and Orange are taken at 3V input, where Red was recorded with zero KV Bias on the membrane ?
And what about the 40% bias increase that you mention, does it mean that HV went from 5KV to 7KV ??
If so, isn't that a potentially dangerous thing to do.
My intention was to measure with a Bias variation by 10%, resp 5KV and 4.5K, corresponding with an AC voltage drop of 10%.
A first conclusion seems that only level but not the bias has effect on the impedance below 1Khz.
The HF impedance peak, in your case at 21.95Khz, is not influenced either by level or bias, right ?
Hans
The more I look at that rolled off HF on the QUAD from Stereophile, the more I am convinced it is bad data.... did not remove room reflections from the data before processing.
Examples show this...... see direct sound (a) and effect of reflections on it (b):
View attachment 818331
THx-RNMarsh
I showed you for one and the same ESL speaker not only the near and the far field FR in my previous home but also the far field in my current listening room.
John Curl's Blowtorch preamplifier part IV
It clearly shows the ESL's strong dependency on the acoustics for the room.
That makes it quite obvious that Stereophile measured far field only and that their room is even more damped than mine.
The point is that most people listen far field, enabling more people at the same time to enjoy the music, that may be their reason why.
So I don't believe that Stereophiles FR is bad data, but for completeness an added near field recording would have given some extra information.
Hans
Hans, Scott.
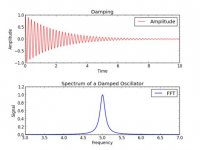
Here are two plots. The first is a damped oscillator with it's FFT I pulled off the web. While the oscillator is a single frequency, the envelope modulation produces sidebands. The FFT, as it is not an instantaneous frequency device, can only show the spreading of the frequency. In that specific case, if the signal is passed through a sharp filter for example, that was hard at 5.1Khz, the actual envelope of the upper plot will change.
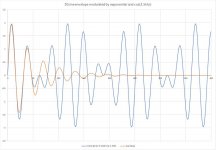
The second is the damped plot I spoke of. The blue is the sin(20k)cos(2.5k), the orange is sin(20k)exp(-whatever). I chose the exponent to make the first two cycles as close as possible for the exponential envelope. That way, I know the initial frequency sidebands will be 22.5k, and they will pull in as the exponential decay continues.
So when the exponentially modulated signal is put through the filter/difference Scott used, the gibbs envelope will take off at first, then taper down as the exponential envelope progresses. When the sidebands have pulled in sufficiently that the upper is below the filter breakpoint, the gibbs will disappear.
I haven't created the time mirrored exp signal yet, but my idea was to start at the exp tail, rise to full value, maintain maybe ten cycles, then exp decay. That way, we could watch the onset of gibbs meaning the sideband exceeds filter cutoff, goes away during stable level, then hits again as the decay begins.
jn
Here are two plots. The first is a damped oscillator with it's FFT I pulled off the web. While the oscillator is a single frequency, the envelope modulation produces sidebands. The FFT, as it is not an instantaneous frequency device, can only show the spreading of the frequency. In that specific case, if the signal is passed through a sharp filter for example, that was hard at 5.1Khz, the actual envelope of the upper plot will change.
The second is the damped plot I spoke of. The blue is the sin(20k)cos(2.5k), the orange is sin(20k)exp(-whatever). I chose the exponent to make the first two cycles as close as possible for the exponential envelope. That way, I know the initial frequency sidebands will be 22.5k, and they will pull in as the exponential decay continues.
So when the exponentially modulated signal is put through the filter/difference Scott used, the gibbs envelope will take off at first, then taper down as the exponential envelope progresses. When the sidebands have pulled in sufficiently that the upper is below the filter breakpoint, the gibbs will disappear.
I haven't created the time mirrored exp signal yet, but my idea was to start at the exp tail, rise to full value, maintain maybe ten cycles, then exp decay. That way, we could watch the onset of gibbs meaning the sideband exceeds filter cutoff, goes away during stable level, then hits again as the decay begins.
jn
Attachments
Last edited:
 Ultima Thule's rule breaking post has been removed.
Is streaming from network (if connected by Ethernet) AES67 or is it something else? If it is would networking your server with a streamer/dac do it?
I'll admit I've not dug deep enough to be able to give a coherent answer yet. They share a lot of the core technologies as they all use a packet network. But things like time sync and latency are baked into AES67. Possibly RTP is actually all the home user needs. I will mimble off and research some more. I also accept that things that are attractive to me, like sending 6 channels of audio down one cat5e cable are not in most people's use cases
")
The initial discussion was if cd rate was sufficient. Cymbals were introduced as an offending signal.
My statement is in essence...
1. When a sine is envelope modulated, there will be sidebands generated. This was my example of 20k modulated by 2.5k.
2. One sideband will be below, the second above the primary signal. And they will show the same spectral shape as the modulating signal.
3. If the primary signal is high enough in frequency, a modulating envelope may produce sidebands where the upper sideband will exceed the filter cutoff. If that occurs, the consequence will be that the envelope of the filter output will be changed from that of the original.
4. A high bandwidth signal such as a cymbal will have envelope modulated components we can hear, producing sidebands above and below primary, as well as ultrasonic components with both upper and lower content. Filtering the upper part out above Fs will still alter the final reproduced envelope.
Using a cymbal recording to evaluate is a mixed bag.. Yes, something is being filtered out, hence the Gibbs differences. But it is impossible to know what is exactly being lost, as it is impossible to understand the instantaneous frequency content of a cymbal.
Examination of how a cymbal actually develops it's sound is, um, impossible. It is a combination of three wave types propagating the disc, three sound velocities, and non linearities out the wazoo. And, edge boundary reflections that are timed based on location of impact, cymbal shape...hopeless..The best we can hope for is to test our filter system using well known and characterized functions.
My example of the sine modulated by a sine, or by an exponential, are the easy types. Unfortunately, an exponential does not have one frequency, nor is it time invariant. FFT analysis does not easily provide an instant by instant spectra, so cannot tell us what part of the waveform will be filtered, just what frequencies.
The Gibbs envelope does. It can show us when the product goes above Fs.
That is why I earlier stated that using the Gibbs envelope is the best way to spot when content is pulled.
And, looking at the Gibbs envelope with cymbals, it is clear the decision to stop at 44k was not perfect... Now, higher rates are not so much a technical challenge..
Jn
Ps.. And no, scottjoplin, it wasn't about ITD...
Last edited:
I showed you for one and the same ESL speaker not only the near and the far field FR in my previous home but also the far field in my current listening room.
John Curl's Blowtorch preamplifier part IV
It clearly shows the ESL's strong dependency on the acoustics for the room.
That makes it quite obvious that Stereophile measured far field only and that their room is even more damped than mine.
The point is that most people listen far field, enabling more people at the same time to enjoy the music, that may be their reason why.
So I don't believe that Stereophiles FR is bad data, but for completeness an added near field recording would have given some extra information.
Hans
Well, you make my point further. This is bad loudspeaker data from Stereophile. ONLY near field measurements (or anechoic) are supposed to be used to measure the speaker itself. No one is interested in someone else's room's affect on any loudspeaker being tested. And rooms are not all the same. It is useless info about the ESL its self, otherwise.
The ESL is quite flat as I also measured.
THx-RNMarsh
Last edited:
Demian,
Great that you already found the time to do some measuring.
Does the Yellow phase curve apply to the Blue Impedance curve taken at around 10V ?
Then you mention Bias on and Bias off.
Do I understand it correctly that Red and Orange are taken at 3V input, where Red was recorded with zero KV Bias on the membrane ?
And what about the 40% bias increase that you mention, does it mean that HV went from 5KV to 7KV ??
If so, isn't that a potentially dangerous thing to do.
My intention was to measure with a Bias variation by 10%, resp 5KV and 4.5K, corresponding with an AC voltage drop of 10%.
A first conclusion seems that only level but not the bias has effect on the impedance below 1Khz.
The HF impedance peak, in your case at 21.95Khz, is not influenced either by level or bias, right ?
Hans
Sorry for the terse notes. The 40% was 40% of normal line voltage. On this unit normal line voltage translates to about 4900V However it starts arcing internally at around 2KV.The biased vs unbiased measurements were at 2 KV or no bias. The impedance curve is from the 10V measurement. Its pretty benign for a capacitive transducer. The HF impedance peak could be from the network and the drivers reacting with the transformers leakage inductance. Given the amplitude of the peak I do suspect a output rolloff around there since it would be hard to get uniform energy into the driver. I don't think there are any acoustic resonances in the driver structure at 23 KHz. Nothing that small I am aware of.
Hans, Scott.
Here are two plots. The first is a damped oscillator with it's FFT I pulled off the web. While the oscillator is a single frequency, the envelope modulation produces sidebands.
jn
I see this stuff, but don't know when I can get back to it. I did ask an expert and the opinion was that we would have to consider critical bands and masking to get a real answer on audibility.
Does anyone know anything about wavelets? (Yes, I've posted something like this before). I only know enough to be dangerous, as the math seems barely within my reach, if that. Wavelets won't show "instantaneous frequency" either, but (depending on the situation and what you want to see) they can show better than an FFT. With different wavelets you can trade off frequency accuracy with amplitude accuracy. It seems ideal (or at least better than the use of FFT I see) for applying to many audio areas.Hans, Scott.
Here are two plots. The first is a damped oscillator with it's FFT I pulled off the web. While the oscillator is a single frequency, the envelope modulation produces sidebands. The FFT, as it is not an instantaneous frequency device, can only show the spreading of the frequency.
Linkwitz used what he called "tonebursts" to measure speakers, they look a lot like wavelets to me (not sure if it's the same offhand, but the raised cosine envelope sure looks similar:
System Test
Furthermore, he made a toneburst generator published in JAES, before the word wavelet was coined:
JAES papers
Quad 63 in room measurements
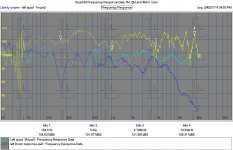
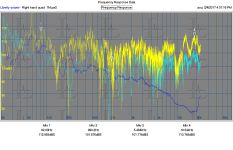
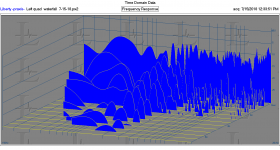
Below are measurements of my Quads (Crosby Mod) in my less than ideal living room. There were from some time ago and I was not being extra careful. I was testing my portable measurement setup.
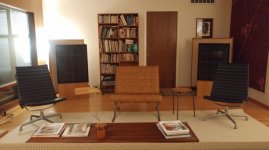
The response measurements were at 1M, 2M and around 4M at the listening position. They are unsmoothed and the windowing was not ideal plus enough room reflections (its a pretty hard surfaced room) to make for lots of issues.
Still you can see they are pretty flat at 1M and roll "nicely" at the listening position. The photo is from the listening position. The chairs etc. were not there when I was measuring but some of us do need to live in our homes. . .
The waterfall was from the same suite of measurements. You can see the value of an electrostatic transducer in the very fast decay.
HF response from a transducer larger than a wavelength will always be a challenge. I was trying to measure a ribbon driver with claimed response to 70 KHz and moving the mike 1/4" made all kinds of differences. I never got a good plot with that setup. The ribbon is 3" X 3/16" or so and there are lots of inference patterns to explore.
Below are measurements of my Quads (Crosby Mod) in my less than ideal living room. There were from some time ago and I was not being extra careful. I was testing my portable measurement setup.
The response measurements were at 1M, 2M and around 4M at the listening position. They are unsmoothed and the windowing was not ideal plus enough room reflections (its a pretty hard surfaced room) to make for lots of issues.
Still you can see they are pretty flat at 1M and roll "nicely" at the listening position. The photo is from the listening position. The chairs etc. were not there when I was measuring but some of us do need to live in our homes. . .
The waterfall was from the same suite of measurements. You can see the value of an electrostatic transducer in the very fast decay.
HF response from a transducer larger than a wavelength will always be a challenge. I was trying to measure a ribbon driver with claimed response to 70 KHz and moving the mike 1/4" made all kinds of differences. I never got a good plot with that setup. The ribbon is 3" X 3/16" or so and there are lots of inference patterns to explore.
Attachments
AES67
Another, perhaps more compelling reason AES67 will not be deployed in home audio is it's lack of support for DRM (Digital Rights Management).
Howie
I'll admit I've not dug deep enough to be able to give a coherent answer yet. They share a lot of the core technologies as they all use a packet network. But things like time sync and latency are baked into AES67. Possibly RTP is actually all the home user needs. I will mimble off and research some more. I also accept that things that are attractive to me, like sending 6 channels of audio down one cat5e cable are not in most people's use cases
Another, perhaps more compelling reason AES67 will not be deployed in home audio is it's lack of support for DRM (Digital Rights Management).
Howie
- Home
- Member Areas
- The Lounge
- The Black Hole......