So I’ve been wanting to do this for a while, and finally have the means, time and weather to do it. I built my THAMs around 2 years ago for uni as part of a reasonably compact system that could take a beating, run of an NU6000DSP so crossovers and EQ are a walk in the park.
Originally loading them with Kappa Pro LF-2s, after a ragging at a party on of the voice coils fused and so I upgraded to the Oberton 15XB700 which simmed pretty well and is a beast of a driver. However, I never really felt like the sub sounded as musical as I had been led to believe by previous reports.
Mattisson originally summed the cab in Hornsrep and got the usual response, however, I skimmed the same cab in Leonard Audio’s 'Transmission Line' software which has an option for modelling tapped horns and got a slightly different response as can be seen by the picture. More of a rising response from 50 Hz towards 110 Hz rather two equally sized peaks at 50 Hz and 110 Hz. I haven’t really looked into the assumptions used by each program yet but sims can only show so much and I recently acquired a decent mic of a friend and so decided to do some measuring using a exponential sine sweep, and some Python code.
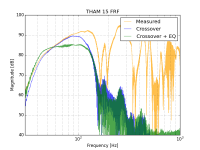
Turns out the response was probably closer to the LA TL software but with some heavy EQing (40 Hz +5dB, Q=0.75, 90 Hz, -6dB Q=0.65), 24dB/octave Butterworth @ 35Hz and 48dB/octave LR @ 120Hz I get a reasonable response.
However i’m still quite confused as to why the driver has such a rising response with very little output at 40 Hz with no eq, contrary to other measured THAMs I’ve seen. My only suggestion currently is that the driver and magnet assembly is noticeably bigger than that of the B&C that the cab was made for but i can’t see it making that much of a difference.
Any suggestions?
Originally loading them with Kappa Pro LF-2s, after a ragging at a party on of the voice coils fused and so I upgraded to the Oberton 15XB700 which simmed pretty well and is a beast of a driver. However, I never really felt like the sub sounded as musical as I had been led to believe by previous reports.
Mattisson originally summed the cab in Hornsrep and got the usual response, however, I skimmed the same cab in Leonard Audio’s 'Transmission Line' software which has an option for modelling tapped horns and got a slightly different response as can be seen by the picture. More of a rising response from 50 Hz towards 110 Hz rather two equally sized peaks at 50 Hz and 110 Hz. I haven’t really looked into the assumptions used by each program yet but sims can only show so much and I recently acquired a decent mic of a friend and so decided to do some measuring using a exponential sine sweep, and some Python code.
Turns out the response was probably closer to the LA TL software but with some heavy EQing (40 Hz +5dB, Q=0.75, 90 Hz, -6dB Q=0.65), 24dB/octave Butterworth @ 35Hz and 48dB/octave LR @ 120Hz I get a reasonable response.
However i’m still quite confused as to why the driver has such a rising response with very little output at 40 Hz with no eq, contrary to other measured THAMs I’ve seen. My only suggestion currently is that the driver and magnet assembly is noticeably bigger than that of the B&C that the cab was made for but i can’t see it making that much of a difference.
Any suggestions?
Attachments
Any suggestions?
Compare the measured impedance curve against the ones predicted by both programs. It's a lot easier to accurately measure impedance than it is to measure frequency response.
There's also the question of which Hornresp model you used for the THAM15. If the sections are "Con" instead of "Par" and if there isn't a value for Vtc (as there is no built-in cone compensation in a THAM layout), then the sim needs to be corrected.
Finally, if your build isn't properly braced, this will result in degraded FR and a degraded impedance curve.
So, I don't currently have the equipment to measure the impedance curve, but in terms of the FR measurement, it should still be reasonably valid, albeit the sensitivity may not be accurate.
In the HR model, the sections are Par, and the build is all fully braced as per Martinsson's plans.
In the HR model, the sections are Par, and the build is all fully braced as per Martinsson's plans.
Last edited:
There are many variables involved in FR measurement that could make it difficult to do right. e.g. does the amp have a flat response across the passband that you're trying to measure? Is the source of the test signal also have a flat response? What about the mic? Are you using a close-miked measurement, or are you doing the measurement at 1M? Is there anything nearby that might affect the accuracy of the measurement?
A DATS can do the impedance measurement in a few seconds. Or you can build your own impedance measurement jig using a few jumper cables and a resistor or two and use REW (free) to perform the measurement.
BTW, I don't think you should be boosting this design at 40 Hz. I think that's below the lowest resonance frequency of the THAM15.
- Status
- This old topic is closed. If you want to reopen this topic, contact a moderator using the "Report Post" button.