Depends on the resonant frequency and Q and where the two points fall relative to resonance. Far enough below resonance, the diaphragm is stiffness controlled. This means the excursion for a given voltage input is nearly independent of frequency. Above resonance it is mass controlled and you have the 4x per octave increase or decrease. Here's a fun picture ")
Attachments
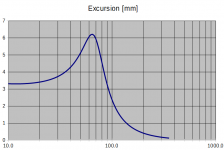
Depends on the resonant frequency and Q and where the two points fall relative to resonance. Far enough below resonance, the diaphragm is stiffness controlled. This means the excursion for a given voltage input is nearly independent of frequency. Above resonance it is mass controlled and you have the 4x per octave increase or decrease. Here's a fun picture
It should be interesting to tune the bass reflex enclosures at the loudspeaker driver FS, no ?
It should be interesting to tune the bass reflex enclosures at the loudspeaker driver FS, no ?
a box with a Q of .707 tuned to driver Fs is a personal favorite.
a box with a Q of .707 tuned to driver Fs is a personal favorite.
You should not go very low without gigantic boxes.
Thank you everyone!
You didn't like my chart showing identical excursion at 40 and 80 for the same input?
You didn't like my chart showing identical excursion at 40 and 80 for the same input?
Those would have a 12dB difference in SPL.
Chris
Those would have a 12dB difference in SPL.
Chris
In an anechoic chamber at a determined distance of the source.
You didn't like my chart showing identical excursion at 40 and 80 for the same input?
Which software do you use please ?
Which software do you use please ?
The example is from a Universal (Benson model) excel sheet I wrote 18-20 years ago
Not for sale or download. The example was intentional to show the original question is not a very good one, and hopefully generate some questions which can be answered definitively.I use various versions of this Excel sheet most of the time, but I also use equivalent circuit models I have cooked up in a piece of spice-like software called QUCS. Very useful for rapid development!
The example is from a Universal (Benson model) excel sheet I wrote 18-20 years ago
I use various versions of this Excel sheet most of the time, but I also use equivalent circuit models I have cooked up in a piece of spice-like software called QUCS. Very useful for rapid development!
Great tool, you are using mathematical models able to predict loudpeakers excursion since years... i'm perhaps too curious but :
Have you compared the calculation to measurements?
Could you give me a rough approximation of your calculation accuracy versus measurements ?
Don't forget the room gain when it's about low frequencies, especially first octave, where simulations can be very misleading...
It's better to stay in the anechoic POV IMHO
The room modes modelisations should give headaches to everyone
Have you compared the calculation to measurements?
Could you give me a rough approximation of your calculation accuracy versus measurements ?
I have not, but it has been done in the literature. Typically within (often well within) a dB for response shape for something as simple as an undamped sealed box. There are a lot of simplifying assumptions, such as parameters that do not change with frequency or level, but they work fairly well. Drivers are not linear so accuracy will depend on level, and on box losses which are not known beforehand.
I have not, but it has been done in the literature. Typically within (often well within) a dB for response shape for something as simple as an undamped sealed box. There are a lot of simplifying assumptions, such as parameters that do not change with frequency or level, but they work fairly well. Drivers are not linear so accuracy will depend on level, and on box losses which are not known beforehand.
Perhaps my brain sometimes sees things more complex than they really are but i was imagining that the cone thickness and weight have a huge influence on the box resonance frequency peak.
I seems to me that only the the losses in the suspension (surround and spider) are taken in acount with the Qms parameters and i don't see how we can calculate accurately the resonnant frequency (with T&S parameters) without making a diference within a thin light paper cone and a thick metallic one.
Thanks !
Intuitively i should try to use the mechanical Q factor in order to trace my impedance bell of Xmax Vs mechanical excution... but
And the story don't involve the loudspeaker alone.
"Depends on the resonant frequency and Q and where the two points fall relative to resonance"
The resonant frequency = resonant frequency of the loudspeaker driver, the box... both ?
Q = total Q
Intuitively i should try to use the mechanical Q factor in order to trace my impedance bell of Xmax Vs mechanical excution... but
An externally hosted image should be here but it was not working when we last tested it.
And the story don't involve the loudspeaker alone.
"Depends on the resonant frequency and Q and where the two points fall relative to resonance"
The resonant frequency = resonant frequency of the loudspeaker driver, the box... both ?
Q = total Q
Last edited:
- Status
- This old topic is closed. If you want to reopen this topic, contact a moderator using the "Report Post" button.
- Home
- Loudspeakers
- Subwoofers
- Cone displacement