Sure, I would like to stick an 18 inch 30 mm xmax driver in a horn and blow my head off but I can't afford high xmax drivers with low inductance, and high inductance drivers give unpredictable response. The Le number we are given is not even close to sufficient to provide an accurate sim of a very high inductance driver. Artificially adding more Le to the sim doesn't help either.
For a couple of years now, every time I look at data-bass.com measurements of high inductance drivers I've thought I could make a sim match the measurements MUCH better with a small adjustments to the driver parameters. (Not extra Le.)
Following are several examples of measurements (all from data-bass.com except the last one), also shown with sims of the same driver in the same enclosure. In each case, the grey line in the sim is a regular sim, the red line is the same sim with a small adjustment (exactly the same adjustment in each example). It's such a simple adjustment it's miraculous it works at all, but in each case it seems to provide a bit more accurate estimate than a regular sim.
All of these drivers have high inductance - the Le number is higher than the Re number in each case.
First up - Sundown ZV3 in a 4.2 cu ft sealed box as measured by data-bass.com.
Second - RE XXX in a 4.5 cu ft sealed box as measured by data-bass.com.
Third - Mach 5 UXL in a 4.2 cu ft sealed box as measured by data-bass.com. Not sure what power this was measured at so ignore spl level.
Fourth - we revisit the XXX again but this time in a ported box. I'm not sure I have the box dimensions right at all here, and also not sure what power level this was measured at so ignore the levels again. The measurement shows less 10 hz bass in the measurement than in my sim, but Ricci did mention that it did measure higher levels at low frequencies when measured from 10 meters.
Fifth - Submaximus front loaded horn with Mach 5 UXL by LTD02, built and measured by asarose. This is the only horn design I am aware of that uses a very high inductance driver. I entered the designer's inputs, exponential flares and all. The peaks are at the right frequencies and the response is peakier in the red sim, better matching the measurement. Unfortunately the high end roll off in the measurement is not reflected in my tweaked (red) sim at all.
For a couple of years now, every time I look at data-bass.com measurements of high inductance drivers I've thought I could make a sim match the measurements MUCH better with a small adjustments to the driver parameters. (Not extra Le.)
Following are several examples of measurements (all from data-bass.com except the last one), also shown with sims of the same driver in the same enclosure. In each case, the grey line in the sim is a regular sim, the red line is the same sim with a small adjustment (exactly the same adjustment in each example). It's such a simple adjustment it's miraculous it works at all, but in each case it seems to provide a bit more accurate estimate than a regular sim.
All of these drivers have high inductance - the Le number is higher than the Re number in each case.
First up - Sundown ZV3 in a 4.2 cu ft sealed box as measured by data-bass.com.
An externally hosted image should be here but it was not working when we last tested it.
Second - RE XXX in a 4.5 cu ft sealed box as measured by data-bass.com.
An externally hosted image should be here but it was not working when we last tested it.
Third - Mach 5 UXL in a 4.2 cu ft sealed box as measured by data-bass.com. Not sure what power this was measured at so ignore spl level.
An externally hosted image should be here but it was not working when we last tested it.
Fourth - we revisit the XXX again but this time in a ported box. I'm not sure I have the box dimensions right at all here, and also not sure what power level this was measured at so ignore the levels again. The measurement shows less 10 hz bass in the measurement than in my sim, but Ricci did mention that it did measure higher levels at low frequencies when measured from 10 meters.
An externally hosted image should be here but it was not working when we last tested it.
Fifth - Submaximus front loaded horn with Mach 5 UXL by LTD02, built and measured by asarose. This is the only horn design I am aware of that uses a very high inductance driver. I entered the designer's inputs, exponential flares and all. The peaks are at the right frequencies and the response is peakier in the red sim, better matching the measurement. Unfortunately the high end roll off in the measurement is not reflected in my tweaked (red) sim at all.
An externally hosted image should be here but it was not working when we last tested it.
Last edited:
This adjustment is very simple and the exact same adjustment is made to all the examples above, so it's far from a polished Le correction routine. In fact I've only spent about an hour on this study so far so I'm amazed I'm getting positive results. But in each case the adjustment seems to provide at least a bit better correlation than a regular sim. In most cases the correlation is much better with the adjustment.
Before I say any more, or work any more on improving this method I want to know a couple of other things.
1. Are there any existing methods of simulating high inductance more accurately? I've never heard of any. Has anyone even bothered trying?
2. If the answer to number 1 is no, does anybody have any time to work on refining a method for more accurately simulating high inductance?
Last edited:
Pray tell. What is the magic adjustment? Boost Mms?
I could give it a go in AkAbak - the TS params use fs and not Cms or Rms but everything else. I think we need to look at the Thiele-Small equations and see what they state as their assumptions and limitations. Could it be that a high Le driver is outside one of those limits? Le is in milliHenry usually and Re is in ohms so not sure how you say the Le exceeds the Re? Can't compare relatively if units are not the same.
I will need to know what your adjustment "knob" is to try it in AkAbak. Are you simply sim'ing a sealed box as used by data-bass.com?
2. If the answer to number 1 is no, does anybody have any time to work on refining a method for more accurately simulating high inductance?
I could give it a go in AkAbak - the TS params use fs and not Cms or Rms but everything else. I think we need to look at the Thiele-Small equations and see what they state as their assumptions and limitations. Could it be that a high Le driver is outside one of those limits? Le is in milliHenry usually and Re is in ohms so not sure how you say the Le exceeds the Re? Can't compare relatively if units are not the same.
I will need to know what your adjustment "knob" is to try it in AkAbak. Are you simply sim'ing a sealed box as used by data-bass.com?
Last edited:
Hi, i'm not sure what "small adjustment" you made ? It might be possible to use for eg LtSpice to sim ?
I'll let you know in a minute...
The problem with Le is that while it does indicate inductance, it doesn't seem to be adequate to describe the reactance above Fs - which is the culprit responsible for the response bump.
Can we simulate that accurately? How?
Pray tell. What is the magic adjustment? Boost Mms?
I'll explain in the next post. It's such a simple process but will take a bit to explain.
Le is in milliHenry usually and Re is in ohms so not sure how you say the Le exceeds the Re? Can't compare relatively if units are not the same.
To compare apples to apples you need to know the Le/Re (or Re/Le) ratio. The Le number itself is meaningless without knowing Re. Is 1 mh Le high or low? Depends on Re.
I will need to know what your adjustment "knob" is to try it in AkAbak. Are you simply sim'ing a sealed box as used by data-bass.com?
I didn't go to great lengths to get the exact dimensions, but I am simulating a cubic shaped sealed box of the correct internal volume as stated by data-bass.com, with the t/s parameters of the driver used as measured by data-bass.com.
For a couple of years now when looking at data-bass.com measurements of high inductance driver, I've thought to myself - That response looks a lot like the effect of added resistance in a sim, but without the sensitivity loss that comes with added resistance. For those not familiar, this is what added Re looks like. The following example is an underdamped tapped horn (light grey line) vs the same horn with Re doubled. When Re is added the response "melts away" and what you are left with is peaks in response corresponding to the frequencies of the impedance peaks. The response "melts away" but the impedance peaks keep the response propped up like tentpoles.
So the process is simple. Add Re and then add some Eg to counter the losses.
In each example in post 1 I simply doubled Re (regardless of the fact that they have different Re/Le ratios - this was just a quick test) and then increased Eg until the curves match in the circled area.
This seemed to work pretty well to give a better match to the response curve shape than a simple sim. BUT since the process changes Eg to an inflated amount, the new value of Eg and the displacement graph won't be at correct levels. The resulting Acoustical Response shown will be at the Eg setting previous to the adjustment. All the other main graphs should be correct.
For example, run the sim at 1 watt. Raise Re and Le as described. The result is the corrected Acoustic Response at 1 watt (regardless of the new Eg value).
If you don't think that could possibly be accurate check example 1 and 2. Those are the only two in which I know how much power was used for the measurement. The response curve shape AND the spl level are more correct than a simple sim.
Maybe later I'll discuss why this is so incredibly important for the more complex alignments. (The measured response of the ported box - example 4 - gives some clues about that.)
An externally hosted image should be here but it was not working when we last tested it.
So the process is simple. Add Re and then add some Eg to counter the losses.
In each example in post 1 I simply doubled Re (regardless of the fact that they have different Re/Le ratios - this was just a quick test) and then increased Eg until the curves match in the circled area.
An externally hosted image should be here but it was not working when we last tested it.
This seemed to work pretty well to give a better match to the response curve shape than a simple sim. BUT since the process changes Eg to an inflated amount, the new value of Eg and the displacement graph won't be at correct levels. The resulting Acoustical Response shown will be at the Eg setting previous to the adjustment. All the other main graphs should be correct.
For example, run the sim at 1 watt. Raise Re and Le as described. The result is the corrected Acoustic Response at 1 watt (regardless of the new Eg value).
If you don't think that could possibly be accurate check example 1 and 2. Those are the only two in which I know how much power was used for the measurement. The response curve shape AND the spl level are more correct than a simple sim.
Maybe later I'll discuss why this is so incredibly important for the more complex alignments. (The measured response of the ported box - example 4 - gives some clues about that.)
Last edited:
Hi just a guy,
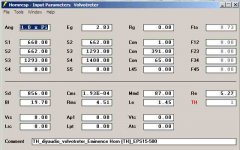
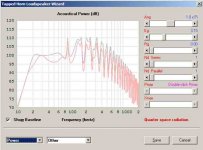
I just gave it a quick try using volvotreter's Eminence Horn.
Tapped Horns
Increased Re to 10.54 Ohm, and Eg to 3.15 V to get the displacement peaks to be similar to before.
If you are correct, this might not be a good TH/driver combination. Volvotreter seemed too like it, sadly he doesn't have any measurements for this TH on his site.
Regards,
Attachments
His Hornresp inputs indicate he's using a low inductance driver (Re 5.27, Le 1.45).
When inductance is that low there's no need to apply a correction, it should sim pretty accurate to the measurement.
Even Lilmike's F20 flh driver (Re 3.04, Le 2.07) which has much higher Le ratio than Volvotreter's doesn't need a correction.
It's the VERY high inductance drivers with Le/Re ratio more than 1 that exhibit these inductance related problems as shown in the data-bass.com measurements.
Despite the fact that Volvotreter's driver is low inductance and doesn't need correction, your sim shows exactly why this issue is very important with very high inductance drivers in complex alignments like horns and the ported box in example 4. The impedance peaks are not spaced properly to keep the low end propped up so you lose your output at tuning. I was going to use this picture to illustrate but yours works just as well.

Tuning lower will space the impedance peaks better so you can keep the output at Fb. The response is still overdamped though. Same driver but with an extended horn, lower tuning.

Tuning lower will space the impedance peaks better so you can keep the output at Fb. The response is still overdamped though. Same driver but with an extended horn, lower tuning.
- Status
- This old topic is closed. If you want to reopen this topic, contact a moderator using the "Report Post" button.
- Home
- Loudspeakers
- Subwoofers
- Simulating high inductance more accurately