Maybe we can persuade David to implement this if we stick together
Sorry, too much work required.
In any event, GM's most recent post would seem to indicate that for a bass reflex system at least, the actual offset positions of the driver and port in the enclosure have little practical effect on the combined response over the frequency range of interest - the dominant factor being the distance between the two outputs, as specified by the path length parameter.
If the 'resonances masked' option is used, then it doesn't matter what the driver and port offsets (relative to the ends of the box) are anyway
.1. Could we please have more flexibility here? Maybe instead of selecting which field to calculate we could select which fields to lock,
example 1. lock throat area and segment length to set values, and only allow the 'calculate' routine to change the other values (mouth area etc.).
example 2. lock mouth area and mouth angle, and only allow the 'calculate' routine to change the other values (throat area, segment length etc.).
2. Why is the throat angle AT for an exponential first segment (no throat) showing non-zero? I realise that if a compression driver is used there is a throat angle matching that needs to be done, but in the case of a driver directly coupled to the horn, this should be zero, shouldn't it?
3. This is the window where I wanted you to add the status bar at the bottom. Not critical - I have printed out the help manual and keep referring to it if I get confused at what each field label means.
4. In the loudspeaker wizard, maybe we could lock certain parameters, like Fta of segment 1 and AT of segment 2. Okay, that might get too complicated.
You can figure it out using the 'path' slider in 'chamber', but both the driver and vent should be at a vented pipe's odd harmonics: internal height [L] x ~ 0.217, 0.349, 0.424, 0.66, 0.714, 0.848 or on top and bottom. The vent opening causes a downward shift, hence the distances being further down that a closed box's 1/5, 1/3rd, etc..
GM
Thanks GM. The path is the internal distance from the radiator to the internal opening of the port?
Well, I could have calculated it, but happen to know that the vast majority of 12" drivers ever made has ~78-78.5"^2/~503.23-506.45 cm^2 diaphragms and ~506 cm^2 is the most common nowadays, so 'took a shot' and it was close enough since it didn't alter Vas much and Fs, Qe, Qm at all, though I could have/just did fine tuned it by changing it in increments till it hit the Vas spec to a couple of decimal places, which at 514.02 cm^2 is well above the norm, so guess it could be due to the high Xmax, but more likely the Vas spec is wrong.
Regardless, in the scheme of things re box design, using the cutout area just sims a little bit bigger box alignment, so your call as to whether you want to use HR to tediously align with the Vas spec [the one most often wrong] or a most common Sd spec.
Anyway, IIRC GRS is noted for [very] inaccurate specs, so both our sims may require significant DSP to perform well.
As you should, I only recommend T/S max flat alignments for outdoor apps, just I have a quick/easy design routine to create a basic compression driver [BP4] to see what's what with this seemingly totally incompatible set of specs and wasn't meant as a suggestion for your app.
GM
Thank you for the response GM! I totally agree with you on the max flat response modeling method. However, I want the response to be flat once the enclosure is in a corner. My current T-TQWT was modeled max flat, yet it sounds flatter when firing away from the corner (more upper bass). I want to prevent that situation from happening again with a ramp up to 80-90hz response.
1. Could we please have more flexibility here? Maybe instead of selecting which field to calculate we could select which fields to lock
All possible "solvable" input combinations are already included in the Horn Segment Wizard.
example 1. lock throat area and segment length to set values, and only allow the 'calculate' routine to change the other values (mouth area etc.).
Insufficient inputs - cannot solve for the other exponential horn parameter values given just S1 and L12.
example 2. lock mouth area and mouth angle, and only allow the 'calculate' routine to change the other values (throat area, segment length etc.).
Insufficient inputs - cannot solve for the other exponential horn parameter values given just S2 and Fta.
2. Why is the throat angle AT for an exponential first segment (no throat) showing non-zero?
Because the angle at the beginning of an exponential horn is not zero degrees. It is only zero in the case of a catenoidal (T = 0) hyperbolic-exponential horn.
Okay, that might get too complicated.
Yes, it would.
The path is the internal distance from the radiator to the internal opening of the port?
No. See attachment.
Attachments
No. See attachment.
Thanks David. I most cases the path length is 0 since the port will be on the same side as the cone, the distance to the listener will be the same. Correct me if I am wrong.
Thanks for the explanation. Functionally, I doubt that I would care about the exported response beyond 2 khz when using this model. OTOH, its easy enough to tweak a filling parameter on those few occasions when bothered by the overflow.Hi Jack,
Murphy can be very frustrating sometimes - many thanks for persisting
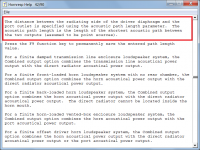
The absorbent filling material model used in Hornresp is a very good one, but breaks down mathematically at high frequencies due to numerical overflows and underflows. There is nothing that can be done about this, and it is why the wizard charts are limited to a maximum frequency of 2000 Hz when absorbent filling material is specified. The exported data however extends to 20000 Hz, which is why the overflow error is occurring. The solution will be to limit the exported data frequency range to 2000 Hz when absorbent material has been specified. I should have done this originally, but completely overlooked the need for it. It will be fixed in the next update.
Further information on the nature of the problem is given in Post #3924: https://www.diyaudio.com/forums/subwoofers/119854-hornresp-393.html#post3747637
Thanks again for reporting this bug. I doubt that I would have found it myself
Kind regards,
David
I meant that calculating after putting in other parameters should not allow the locked parameters to be altered.Insufficient inputs - cannot solve for the other exponential horn parameter values given just S1 and L12.
Insufficient inputs - cannot solve for the other exponential horn parameter values given just S2 and Fta.
In most cases the path length is 0 since the port will be on the same side as the cone, the distance to the listener will be the same. Correct me if I am wrong.
Hi Mårten,
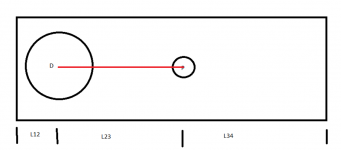
The acoustic path length is the length of the shortest acoustic path between the two outputs (assumed to be point sources). For your example, that means the length of the red line shown in the attachment, or in other words, the value of L23. It is not the difference in the distances from each output to the listener.
Kind regards,
David
Attachments
I meant that calculating after putting in other parameters should not allow the locked parameters to be altered.
Using your first example:
1. lock throat area and segment length to set values, and only allow the 'calculate' routine to change the other values (mouth area etc.).
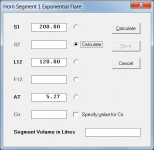
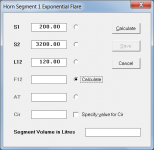
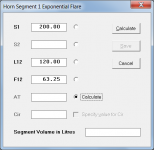
Attachment 1 shows the settings required to "lock" S1 = 200 and L12 = 120 and allow the value of AT to be entered before calculating the other parameter values.
Attachment 2 shows the settings required to "lock" S1 = 200 and L12 = 120 and allow the value of S2 to be entered before calculating the other parameter values.
Attachment 3 shows the settings required to "lock" S1 = 200 and L12 = 120 and allow the value of F12 to be entered before calculating the other parameter values.
The are no other solvable input options for an exponential segment with S1 and L12 "locked". You can confirm this for yourself by studying the equations defining the geometry of an exponential horn.
Attachments
Hi Mårten,
The acoustic path length is the length of the shortest acoustic path between the two outputs (assumed to be point sources). For your example, that means the length of the red line shown in the attachment, or in other words, the value of L23. It is not the difference in the distances from each output to the listener.
Kind regards,
David
Hmm... then I stand corrected on that issue, because I always thought it to be the latter. Does this apply to offset TLs as well?
A change was made to the calculation method for combined responses in Hornresp Update 4060-170521
The new method is a power response calculation that considers the total sound power radiated.
This makes the combined response consistent with the individual source responses which have always been power response.
The combined power response of two sources is dependent on their individual magnitude/phase, and the separation distance between them. The pressure response @ 1m is then calculated for a point source having the equivalent power response. The relative distances between listener and sources does not come into play, only the separation distance between the sources.
Additional information/clarification can be found here:
Hornresp Post #7383
Hornresp Post #8516
Hornresp Post #8521
Hi Mårten,
The acoustic path length is the length of the shortest acoustic path between the two outputs (assumed to be point sources). For your example, that means the length of the red line shown in the attachment, or in other words, the value of L23. It is not the difference in the distances from each output to the listener.
Kind regards,
David
Thanks for the clarification David.
Just out of curiosity, is the port a point source in the simulation? Having mass but no depth?
I'm trying to "wrap my brain" around this change, and the reason for it, and I'm not sure I get it.
Consider the following extreme example (see attached image). Say the drivers and vent in each box are separated by 1/2W @ 400 Hz, where the first vent resonance effect appears. Are we saying that the "path" information for them would be the same and therefore the predicted response from Hornresp would be the same?
Because I expect that they would measure very differently around 400 Hz at the given listening position, because the phase relationship between the two sources would be different at that position.
Attachments
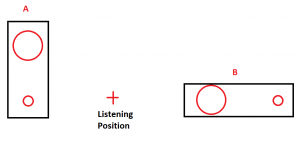
Yes. The power response for both examples is the same. Power response is not dependent on mic position, as it is in essence a summation of all mic positions on the surface of a sphere(or part of a sphere) around the sources(which are considered to be point sources). This is no different than how Hornresp calculates acoustic output for individual sources(ie point source power response). DMcBean will likely have some additional comments on why Hornresp was developed as a power response calculator.…Are we saying that the "path" information for them would be the same and therefore the predicted response from Hornresp would be the same?
Not sure about 400Hz since the vent likely won’t have much output, but if you are making measurements near the enclosure where distances (mic-to-vent) and (mic-to-woofer) have significant differences you will see differences in summation as you move around the enclosure. But, at low frequencies you will find that the power response is a better match for what you would measure in an outside ground-plane test at a typical listening distance of a couple meters.…I expect that they would measure very differently around 400 Hz at the given listening position, because the phase relationship between the two sources would be different at that position.
Just out of curiosity, is the port a point source in the simulation? Having mass but no depth?
Hi Mårten,
In your bass reflex example, for the purposes of combining the two sound outputs, both the driver and the port are considered to be point sources. A point source is simply an acoustic radiator having dimensions that are small compared to the wavelength.
The air in the actual port tube has mass and depth, both of which are taken into account in the simulation.
Kind regards,
David
Hi bolserst,
Thanks for providing the detailed explanation and the reference links - you have saved me some work.
Determining the directivity characteristics necessary to enable the pressure response to be calculated would require the use of finite element analysis. Testing has shown that this slows the operation of Hornresp (on my computer at least) to an unacceptable level. A simple one-parameter directivity model has however been included, which gives indicative results. At low frequencies the difference between the power and pressure responses is not that large anyway, due to the omnidirectional nature of the sources at those frequencies.
Kind regards,
David
The power response for both examples is the same.
Thanks for providing the detailed explanation and the reference links - you have saved me some work
.DMcBean will likely have some additional comments on why Hornresp was developed as a power response calculator.
Determining the directivity characteristics necessary to enable the pressure response to be calculated would require the use of finite element analysis. Testing has shown that this slows the operation of Hornresp (on my computer at least) to an unacceptable level. A simple one-parameter directivity model has however been included, which gives indicative results. At low frequencies the difference between the power and pressure responses is not that large anyway, due to the omnidirectional nature of the sources at those frequencies.
Kind regards,
David
Does this apply to offset TLs as well?
Yes.
At low frequencies the difference between the power and pressure responses is not that large anyway
Just to clarify - this statement applies to a bass horn system.
- Home
- Loudspeakers
- Subwoofers
- Hornresp