Hornresp Update
Hi Everyone,
The Loudspeaker Wizard tool chart frequency range can now be toggled between 10 - 2000 hertz and 100 - 20000 hertz by double-clicking on the X-axis "Frequency (hertz)" label. My thanks to Mike for suggesting this enhancement.
The latest Hornresp release is Product Number 2870-110916.
Kind regards,
David
The Loudspeaker Wizard tool chart frequency range
Hi David,
Must have missunderstood
 . Can´t make it work. Give me a hint.
Must have missunderstood. Can´t make it work. Give me a hint.
Hi Lars,
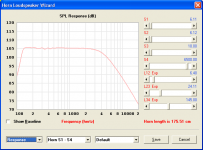
Display any one of the Loudspeaker Wizard charts and then move the mouse pointer over the "Frequency (hertz)" label beneath the chart. The font colour should change from black to red to indicate that the label has been activated. Now double-click on the red label, and the chart frequency range should change.
The screenprint below shows the response chart with the frequency range changed to 100 - 20000 hertz. (The impedance and displacement chart ranges are also changed automatically).
Could you please confirm that the functionality works as described above. Thanks.
Kind regards,
David
Attachments
Hi David,
I've been "testing" 2870-111007
Looks like sometimes I have to go back and forth between records, re-plotting to get the compare feature working for System Efficiency, Sound Pressure, and Particle Velocity. The compare text in the button appears in grey intermittently/randomly...annoyingly
Still love Hornresp though, thanks David!
I've been "testing"
2870-111007Looks like sometimes I have to go back and forth between records, re-plotting to get the compare feature working for System Efficiency, Sound Pressure, and Particle Velocity. The compare text in the button appears in grey intermittently/randomly...annoyingly
Still love Hornresp though, thanks David!
Sensitivity of Phase Response Plot
Hi David,
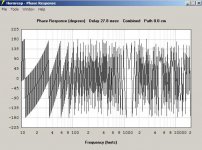
I may have found another minor bug (Version 2870-111003). The sensitivity of the phase screen plot seems to need a little tuning, this is especially obvious on vented (bass reflex) enclosures, or so it seems. I found a particularly nasty looking one, I'm attaching a screen plot of the phase response with the default delay (you have to go to delay=0.0msec before the excessive "wrapping?" goes away) and the Hornresp export file.
Regards,
Hi David,
I may have found another minor bug (Version 2870-111003). The sensitivity of the phase screen plot seems to need a little tuning, this is especially obvious on vented (bass reflex) enclosures, or so it seems. I found a particularly nasty looking one, I'm attaching a screen plot of the phase response with the default delay (you have to go to delay=0.0msec before the excessive "wrapping?" goes away) and the Hornresp export file.
Regards,
Attachments
Looks like sometimes I have to go back and forth between records, re-plotting to get the compare feature working for System Efficiency, Sound Pressure, and Particle Velocity. The compare text in the button appears in grey intermittently/randomly
Hi Dan,
The System Efficiency, Sound Pressure and Particle Velocity charts are generated when the tools are selected, not when the Calculate button is pressed. For this reason comparisons can only be made against previously displayed or captured charts.
Note that this operation is different to that of the main default charts, which are all calculated even when not displayed.
Kind regards,
David
I may have found another minor bug (Version 2870-111003). The sensitivity of the phase screen plot seems to need a little tuning, this is especially obvious on vented (bass reflex) enclosures, or so it seems. I found a particularly nasty looking one, I'm attaching a screen plot of the phase response with the default delay (you have to go to delay=0.0msec before the excessive "wrapping?" goes away) and the Hornresp export file.
Hi Oliver,
Thanks for this feedback. I had noticed the same thing myself, but never got around to investigating it - I had assumed that the phase of the combined signal would be pretty weird anyway
. It is interesting that changing the path length difference from 0 cm to 1 cm tidies things up considerably.I will have a look and see what I can find - at this stage, I am not really sure where to begin though
.Kind regards,
David
Hornresp has more Easter eggs than anything I can think of, but I forget the codes.
Thanks for the explanation David. Is it possible to add the undocumented features to the help file? I seem to be having memory issues... I wanted to compare off axis responses from separate records and I can't figure it out.
Hi Dan,
The System Efficiency, Sound Pressure and Particle Velocity charts are generated when the tools are selected, not when the Calculate button is pressed. For this reason comparisons can only be made against previously displayed or captured charts.
Note that this operation is different to that of the main default charts, which are all calculated even when not displayed.
Kind regards,
David
Thanks for the explanation David. Is it possible to add the undocumented features to the help file? I seem to be having memory issues... I wanted to compare off axis responses from separate records and I can't figure it out.
I have been fooling around with some vented subwoofer designs. I think there may be something amiss in the vent air speed velocity calculation. When I increase voltage input the velocity does not increase accordingly.
Hi Mark,
Could you provide a specific example, please?
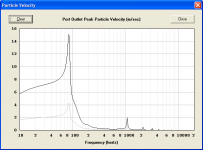
The test I did seemed to work okay - I simply took a copy of the default record and changed Fr to Ap, then compared the port air velocities with Eg = 2.83 volts and Eg = 10.00 volts. In the attached screenprint the gray trace is for Eg = 2.83V and the black trace is for Eg = 10V.
I then changed Ang to 2.0 x Pi and checked the results in AkAbak - they were identical to those generated by Hornresp with Ang = 2 Pi.
Kind regards,
David
Attachments
Is it possible to add the undocumented features to the help file? I seem to be having memory issues... I wanted to compare off axis responses from separate records and I can't figure it out.
Hi Dan,
To compare the off-axis SPL responses of two different records it is necessary to 'capture' the off-axis response of the first record. The Compare section on page 12 of the Help file refers:
"Previous results are used in comparisons by default. Press Ctrl+C to capture the current results or Ctrl+X to release captured results. Results can also be captured or released by right-clicking any chart. Press F4 to show or hide previous or captured results."
If the off-axis results of the first record are not captured, then by default the comparison will be between the constant directivity response of the second record (the 'previous' result) and the off-axis response of the second record (the 'current' result).
Kind regards,
David
I think that I am unable to simulate the vent air particle velocity. I'm able to easily simulate the driver particle velocity.
It is quite possible that I am just not doing something correctly.
I see that you have a screen heading that indicates vent particle velocity.
I must admit to not being able to figure out how to get there.
It is quite possible that I am just not doing something correctly.
I see that you have a screen heading that indicates vent particle velocity.
I must admit to not being able to figure out how to get there.
Last edited:
I think that I am unable to simulate the vent air particle velocity.
Hi Mark,
To chart the port outlet peak particle velocity first use the Combined Response tool with a blank entered to display the port SPL response, and then select the Particle Velocity tool.
Kind regards,
David
I will have a look and see what I can find.
Hi Oliver,
I found the problem - it will be fixed in the next release. Thanks again for the feedback.
Kind regards,
David
Hi Dan,
On further testing I agree that this way of operating can be rather confusing. In the next release the System Efficiency, Sound Pressure and Particle Velocity charts will be calculated when the Calculate button is pressed, not when the tools are selected. Thanks for raising this issue.
Kind regards,
David
The System Efficiency, Sound Pressure and Particle Velocity charts are generated when the tools are selected, not when the Calculate button is pressed. For this reason comparisons can only be made against previously displayed or captured charts.
On further testing I agree that this way of operating can be rather confusing. In the next release the System Efficiency, Sound Pressure and Particle Velocity charts will be calculated when the Calculate button is pressed, not when the tools are selected. Thanks for raising this issue.
Kind regards,
David
I figured it out!
Thanks David.
Empty box means exactly that nothing in the entry. Not even a zero.
Dumb is me. Now I see the nice red information to leave things blank for port particle velocity. When will I ever learn!
But had you not explained that I would never have figured it out.
Perhaps a drop down menu?
May be a bit easier.
Last edited:
Perhaps a drop down menu? May be a bit easier.
Hi Mark,
We don't want to make things too obvious - half the fun is in working out how to take full advantage of the functionality available in Hornresp
.Kind regards,
David
Hornresp Update
Hi Everyone,
The issue highlighted by Dan in post #2285 and the problem reported by Oliver in post #2286 have now both been resolved. The latest Hornresp release is Product Number 2870-111015.
My thanks to Dan and Oliver for their valuable feedback.
Kind regards,
David
Hi Everyone,
The issue highlighted by Dan in post #2285 and the problem reported by Oliver in post #2286 have now both been resolved. The latest Hornresp release is Product Number 2870-111015.
My thanks to Dan and Oliver for their valuable feedback.
Kind regards,
David
- Home
- Loudspeakers
- Subwoofers
- Hornresp