Max spl does not use the standard hornresp power input field, but the max power as defined in the driver data (or the max power input window). I already tried to explain it to you here:Then go to maximum spl and simulating low power
https://www.diyaudio.com/community/threads/ajhorn-works-but-not-horn-response.411533/#post-7658188
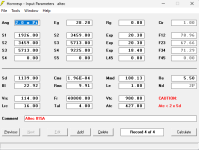
Hi all, I'd appreciate some help modelling the Altec 815A enclosure with 2 x Altec 421 8H 15" drivers.
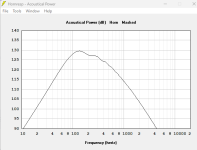
First Question: the cabinet is supposed to play from 100 - 1000Hz. Looks like my modelled response is dropping off well before 1000Hz. do we agree that there must be an error in what Ive input?
Second questions: I'm not sure if anyone can spot what I've got wrong here. One thing I'm a bit confused about is modelling in the throat hole for the driver. So I've made S1 the entire crossection of the start of the horn. Then I've input the area of the openings for the drivers in the "Atc" field and added the approx area of the hole for 1 driver. I assume it knows there are two such throat areas because I've selected 2 drivers.
Any tips appreciated.
Thanks.
Lachlan.
Attachments
When you simulate a response and then adjust it using the loudspeaker wizard, you see the acoustic power response. Then go to maximum spl and simulating low power, even just 1watt the response drastically changes.
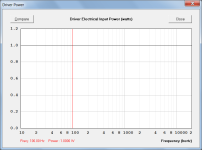
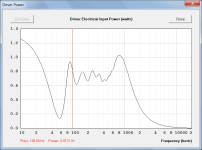
The results are different for the two cases because the input powers are different.
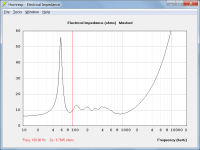
Using the default record with chamber resonances masked as a test example:
Case 1 - Calculate button clicked. The input signal is a constant 2.83 volts. Although the input voltage is constant the input power is not, because of variations in the electrical input impedance.
Case 2 - Maximum SPL tool used. The input signal is a constant 1 watt.
Attachment 1 shows the variation in input impedance.
Attachment 2 shows the input power for Case 1.
Attachment 3 shows the input power for Case 2.
Attachments
Hi all, I'd appreciate some help modelling the Altec 815A enclosure with 2 x Altec 421 8H 15" drivers.
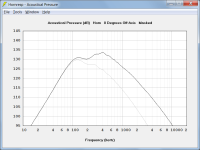
What you are looking at is the power response, which is the total output of the speaker over all directions. If you go to Tools -> Directivity -> Response, you can calculate the pressure frequency response in one particular direction, which is more similar to what what you would actually measure with a microphone at one position.
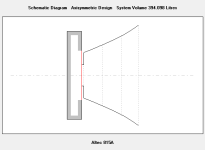
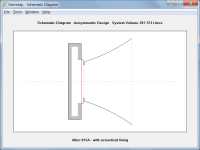
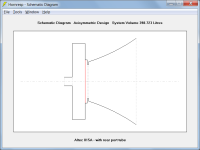
But note that can only be used for single segment horns, so you'll have to replace the 3-segment horn with a single exponential segment having the same entrance and exit areas.
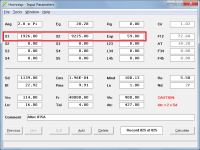
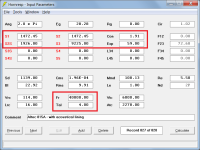
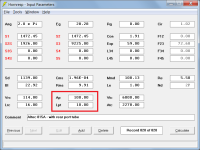
Atc and Vtc are the total area and volume of the throat chamber, not per driver. In Hornresp, multiple drivers are treated as one driver with compound parameters (for instance, twice the Sd, twice the Mmd etc,, but you don't have to worry about that part). But that only applies to the driver itself, not any of the horn or enclosure geometry.
But really, in this case, Atc should be 2xSd, and Vtc should be the total volume in front of the cones (there's a tool to calculate the volume in front of one cone if you double click on the Vtc or Atc labels). And there should be a short straight segment in front of the horn to account for the driver mounting board. But that means you can't calculate the pressure frequency response.
But in the end, if you compare the various versions of Vtc/Atc, the differences are very small since the horn is essentially a 1:1 compression ratio design. Do the comparisons with approximate values, and see if the differences are worth the trouble of getting the model more accurate. And also consider that Hornresp can't take the fine details of the 3D geometry into account anyway.
Looks like my modelled response is dropping off well before 1000Hz. do we agree that there must be an error in what Ive input?
There is no error, it's just that the power response has been calculated, rather than the pressure response.
To calculate the pressure response, replace the three horn segments with a single Exp segment as shown in Attachment 1 then use the Directivity Response tool. Attachment 2 compares the power response (grey trace) to the on-axis pressure response (black trace).
One thing I'm a bit confused about is modelling in the throat hole for the driver.
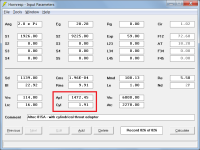
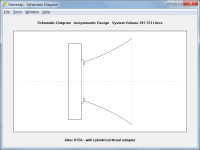
The throat section can be more accurately modelled using a cylindrical throat adaptor as shown in Attachments 3 and 4, but then only the power response can be calculated.
Including the refinement makes very little difference to the results.
EDIT: I see that Bjørn just beat me to the punch
") .
.Attachments
Last edited:
Thank you so much for your guidance this was very helpfulWhat you are looking at is the power response, which is the total output of the speaker over all directions. If you go to Tools -> Directivity -> Response, you can calculate the pressure frequency response in one particular direction, which is more similar to what what you would actually measure with a microphone at one position.
But note that can only be used for single segment horns, so you'll have to replace the 3-segment horn with a single exponential segment having the same entrance and exit areas.
Atc and Vtc are the total area and volume of the throat chamber, not per driver. In Hornresp, multiple drivers are treated as one driver with compound parameters (for instance, twice the Sd, twice the Mmd etc,, but you don't have to worry about that part). But that only applies to the driver itself, not any of the horn or enclosure geometry.
But really, in this case, Atc should be 2xSd, and Vtc should be the total volume in front of the cones (there's a tool to calculate the volume in front of one cone if you double click on the Vtc or Atc labels). And there should be a short straight segment in front of the horn to account for the driver mounting board. But that means you can't calculate the pressure frequency response.
But in the end, if you compare the various versions of Vtc/Atc, the differences are very small since the horn is essentially a 1:1 compression ratio design. Do the comparisons with approximate values, and see if the differences are worth the trouble of getting the model more accurate. And also consider that Hornresp can't take the fine details of the 3D geometry into account anyway.
And there should be a short straight segment in front of the horn to account for the driver mounting board.
Using two stepped segments as suggested by Bjørn rather than one segment together with a cylindrical throat adaptor as suggested by me, has the advantage that it is then possible to also specify either acoustical lining material or a rear port tube if necessary, as shown in the attachments.
Attachments
Hornresp Update 5540-240424
Hi Everyone,
CHANGE
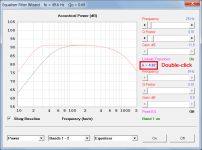
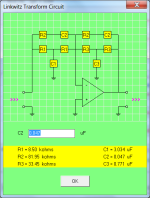
Double-clicking on the Linkwitz Transform k parameter in the Equaliser Filter Wizard when filter band 1 is On and the k value is positive now displays the resistor and capacitor values for the Linkwitz Transform circuit.
The default value for capacitor C2 is 0.047 microfarads but the user can specify a different value if required.
Kind regards,
David
Hi Everyone,
CHANGE
Double-clicking on the Linkwitz Transform k parameter in the Equaliser Filter Wizard when filter band 1 is On and the k value is positive now displays the resistor and capacitor values for the Linkwitz Transform circuit.
The default value for capacitor C2 is 0.047 microfarads but the user can specify a different value if required.
Kind regards,
David
Attachments
The results are different for the two cases because the input powers are different.
Using the default record with chamber resonances masked as a test example:
Case 1 - Calculate button clicked. The input signal is a constant 2.83 volts. Although the input voltage is constant the input power is not, because of variations in the electrical input impedance.
Maybe i didn't get it, but i think it would be helpful if the constant defined voltage 2.83 volts could be set by the user, e.g. to 10volts, to see where the limits of excusion etc. are. E.g. if you have an amp which can deliver 10Volts, what would the fr look like(the same but higher db of course, but also the limits at diffrent frequencies) with a given HR-Box.
The input signal is a constant 2.83 volts.
Just to clarify, the above means that the voltage stays the same regardless of the load impedance or the frequency. In other words, the Hornresp amplifier is by default an ideal or constant voltage source.
The level is fixed at 2.83 volts (1 watt into 8 ohms) for the default first record only. As Bjørn and grindstone have shown, for all other records the user can specify the voltage level setting.
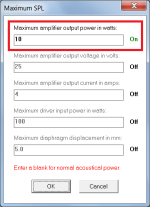
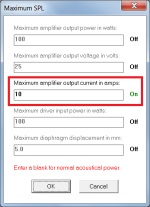
Using the Maximum SPL tool it is also possible to make the Hornresp amplifier act as a constant current source (Attachment 1) or as a constant power source (Attachment 2) rather than as the default constant voltage source.
Attachments
Yes, pretty much, if it looks like this?:Maybe the Hornresp Paraflex Model Type 1 or type 2 can be used to give you an approximation.
Type2 seems to have a chamber between the sub and rear chamber?
While Type1 has a chamber between the sub and front chamber and Type3 has two in between chambers?
Type1 and Type3 seem to agree with each other:
Tuning seems to be about 26/52Hz
But why do I get different results with 6th order?
Lower peaks and lower tuning, about 24/48Hz.
Changing the woofer placements to the ends like in Paraflex it doesn't change much:
Is the change just because of the stub in Paraflex, the thing I was worried about?
Or is it because in Paraflex the input of the stub comes in at halfway of the front port, thus shortening the front port and raising tuning?
Last edited:
The tap of the Paraflex has to be in the exact same spot as the BP6S to get the same results.Yes, pretty much, if it looks like this?:
View attachment 1303366
Type2 seems to have a chamber between the sub and rear chamber?
While Type1 has a chamber between the sub and front chamber and Type3 has two in between chambers?
Type1 and Type3 seem to agree with each other:
View attachment 1303355
View attachment 1303354
Tuning seems to be about 26/52Hz
But why do I get different results with 6th order?
View attachment 1303356
Lower peaks and lower tuning, about 24/48Hz.
Changing the woofer placements to the ends like in Paraflex it doesn't change much:
View attachment 1303359
Is the change just because of the stub in Paraflex, the thing I was worried about?
Or is it because in Paraflex the input of the stub comes in at halfway of the front port, thus shortening the front port and raising tuning?
All the segment volumes have to be exactly the same.
Those 2 reasons are also why you should get the same results between a straight flare TH and a BP6S.
- Home
- Loudspeakers
- Subwoofers
- Hornresp