
Ssassen, you asked for comparison with other amplifiers
Here are three amplifiers with comparable parameters
????? ?? ??????? ????????? ?? AD844
in my amplifier (R2018-06) increased the supply voltage to + -55 V
Here are three amplifiers with comparable parameters
????? ?? ??????? ????????? ?? AD844
in my amplifier (R2018-06) increased the supply voltage to + -55 V
Attachments
Last edited by a moderator:

Petr, can you communicate what these amps are, what circuitry, where they are different, in what respect, what the graphs show, under which conditions, etc. In other words, discuss!
Just throwing up graphs that nobody knows what the hell it is, will not help anyone and only wastes your and our time!
Jan
Just throwing up graphs that nobody knows what the hell it is, will not help anyone and only wastes your and our time!
Jan
This is not the first time I have presented the measurement results in this form and so far no one has asked questions, I thought that everyone understands
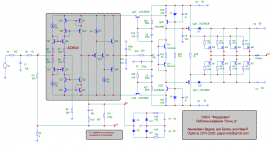
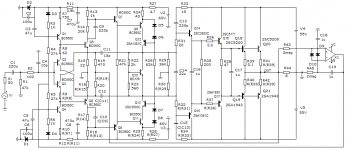
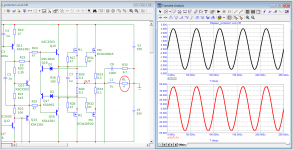
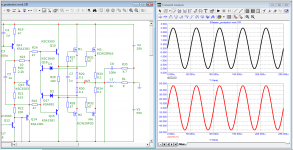
The circuit of my amplifier is published in the Russian magazine Radio 2018-06
Unlike the original, I increased the power supply to conduct tests under the same conditions
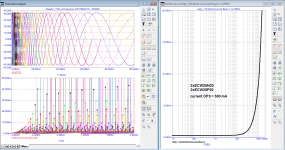
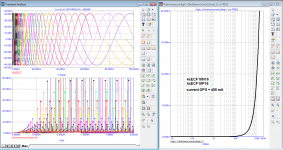
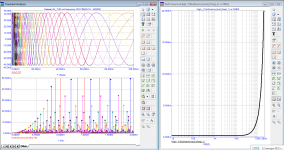
Presented graphs - dependence of THD on frequency
On the left side, the spectra of harmonics are shown when sinusoidal signals are applied to the input, starting from a frequency of 400 kHz and further with each step, the frequency decreases by 10%.
Rendering ends at a frequency of 10 Hz.
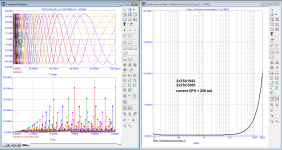
The right side shows THD in% for signals from 10 Hz to 200 kHz
the third graph is the graph of the circuit discussed here
The circuit of my amplifier is published in the Russian magazine Radio 2018-06
Unlike the original, I increased the power supply to conduct tests under the same conditions
Presented graphs - dependence of THD on frequency
On the left side, the spectra of harmonics are shown when sinusoidal signals are applied to the input, starting from a frequency of 400 kHz and further with each step, the frequency decreases by 10%.
Rendering ends at a frequency of 10 Hz.
The right side shows THD in% for signals from 10 Hz to 200 kHz
the third graph is the graph of the circuit discussed here
Attachments
Last edited:
This is not the first time I have presented the measurement results in this form and so far no one has asked questions, I thought that everyone understands
without having a clue as to what we're comparing, under what conditions etc. these graphs are somewhat meaningless due to lack of context.
Another mystery solved! ;-)
Use it to your advantage.
Jan
Ssassen, the parameters of your amplifier meet the requirements of the reference amplifiers:
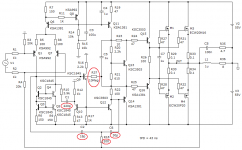
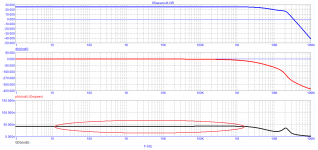
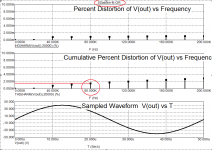
The delay time of the signal passage does not exceed 100 ns
Group Delay constantly from fractions of Hertz to 200 kHz
Without changing the operating modes of the amplification stages, I changed the values of the correcting circuits
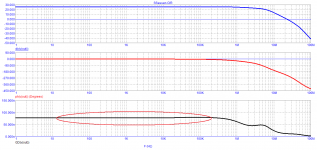
Time Propagation delay reduced to 43 ns (approximately 2 times)
The duration of the Group Delay was extended by an order of magnitude
see pictures
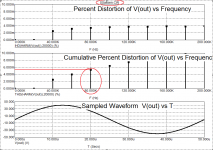
The delay time of the signal passage does not exceed 100 ns
Group Delay constantly from fractions of Hertz to 200 kHz
Without changing the operating modes of the amplification stages, I changed the values of the correcting circuits
Time Propagation delay reduced to 43 ns (approximately 2 times)
The duration of the Group Delay was extended by an order of magnitude
see pictures
Attachments


I don’t get it.
Nobody get it, but Alexander Petrov still simulate knowledge.
I changed the values of the correcting circuits
... and he means compensation circuits.
Jan
Compare the results of two tests with each otherPetr-2009,
Could you please explain first of all the benefit of reducing propagation from 100ns to 43ns up to 200Khz, that’s 0.3 degrees at 20Khz.
I don’t get it.
Hans
If you don't see the difference, then I won't help you.
I'm not going to overpersuade or convince those who believe that the time Propagation Delay does not affect anything, just walk by your own way.
By the way, in Graham amplifiers, the time Propagation Delay is about 30 ns; therefore, the introduced distortions do not depend on the measurement period.
In another branch, I showed by the example of a composite in which tPD = 1.5 μs and distortion in the steady-state mode 0.000000005%, and in the first period 0.8%
At the same time, in the Graham amplifier, due to the low signal transmission delay, distortions are equally small at any period.
Attachments

Here are two more tests in the form of food for floodists ...Petr-2009,
Could you please explain first of all the benefit of reducing propagation from 100ns to 43ns up to 200Khz, that’s 0.3 degrees at 20Khz.
I don’t get it.
Hans
This is what Graham was trying to convey
Attachments
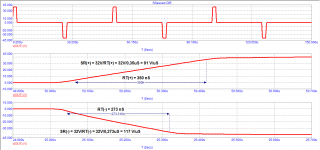
check the effectiveness of the protection
according to the graphs, it is easy to calculate at what currents the limitation occurs
in the event of a short circuit in the load, the protection circuit will perform its function
according to the graphs, it is easy to calculate at what currents the limitation occurs
in the event of a short circuit in the load, the protection circuit will perform its function
Attachments
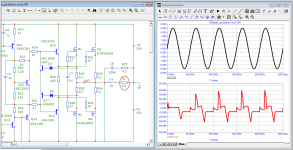
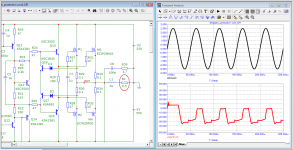
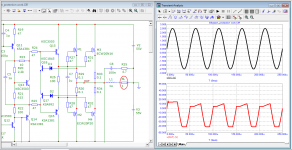
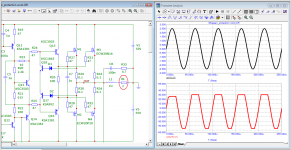
single-ended voltage amplifier, hence the slew rate of the output voltage is asymmetric
And as for Graham's "nonsense", so it is confirmed in practice
Since nobody reacts, I could not resist to do so.
Yes, what you say is nonsense for several reasons:
1) We are looking at an audio amp.
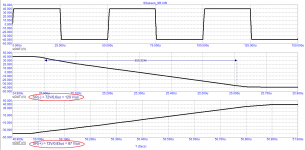
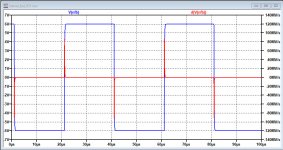
At 20Khz@100Watt in 8R, which is insane, slew rate is 5V/usec.
So taking a safety margin of a factor 2 brings us to a minimum requirement of 10V/usec.
2) Feeding the amp with a 0.1usec rise/fall square wave, up to an output signal of +/-6Volt, this amp is producing a perfect symmetrical slew rate of an almost perfect 90V/usec, see image below.
Hans
Attachments
Hans Polak, sometimes it's better to remain silent ...Since nobody reacts, I could not resist to do so.
Yes, what you say is nonsense for several reasons
I can see differences, but do not understand what it means. How do these (simulation or real world) measurements affect the specifications of the amplifiers involved. What is compared to what? What is better and why? Are things audiable? Are obvious distortions with a 0.1Ω load important? Why this emphasis on these specific kind of measurements less people seem to understand then you assumed? What is it telling us, in plain words? You cannot leave us in the dark with: "If you don't see the difference, then I won't help you." Come on.
If you can't explain it properly, it is cold nuclear fusion to me.
If you can't explain it properly, it is cold nuclear fusion to me.
Well, preference of design may differ between people, as taste and all the other things we're experience, and a perpendicular view will enlighting this even more, but only if the message is carried on a proper medium. So with all scientific issues, even on this humble DIYaudio platform and with all respectfull contributing members, the proof of the pudding is in the eating.
Thus said, I invite petr_2009 to elaborate on the addressed posts: measurement setups, references, articles to consider, and all the other obvious explanations, in the interest of all the common people. Let us be aware of our different perspectives and opinions, and grant others' ditto! Fair play & Facts!
ps:
I cannot resist to attach my most favourite picture from the net, which can be assumed as a wiring diagram of a guaranteed phase-straight audio recording setup... cough.
dW
Attachments
- Home
- Amplifiers
- Solid State
- Musings on amp design... a thread split