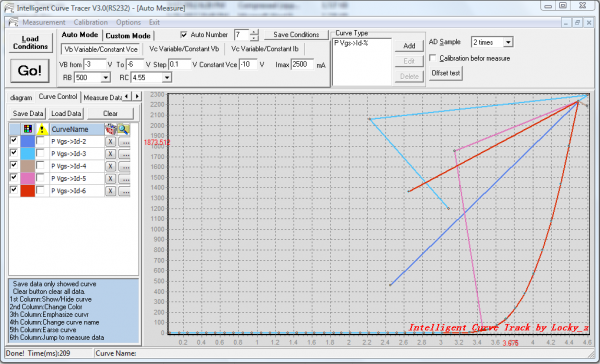
This Vgs-Id curve,
You can load 'N-JFET Vgs-Id' measure condition.
And you can modify the 'Curve type' to control them show in different quadrant.
Example X Axis define is 'Vgs=abs(Vbe)' , abs() mean absolute value,so X-value is all positive,
Y axis define is ‘Id=abs(Ic)’, It is the same positive value.
So the curve will show in the first quadrant.
If you not use abs() function, The N-JFET Vgs-Id curve will show in the second quadrant,The P-JFET will show in the fourth quadrant, then you hard to compare them.
troubles and suggestions
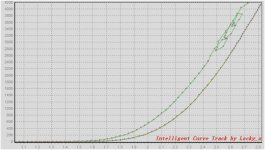
After modifying the device to do high current measurements I now obtain very reproducible traces to above 4A with NMOS DUT's. Moving to (complementary) PMOS devices, the curves however go "crazy" (fluctuate) at currents above about 2.5A using equivalent settings.
What is causing this? Anybody else seeing the same thing?
The device auto-numbering feature is useful, but would be much better if it gave an output like: "text-001, text-002, text-003 etc.", rather than: "text-1, text-2, text-3". It is painful to sort the current labeling in software like excel......
Anybody else seeing the same thing?
You mean like this ?
Yes I do.
Curves are for an IRFP9240
Yes, but much less dramatic. My traces continue to rice a still looks a tiny bit like curves.....
I will post an image when I find out how to make window screen shots on a PC and where the shots gets filed (unfortunately I'm a devoted Mac user)....
Edit: is it also P-Channel specific in your case or do you also see it on N-Channel devices?
I will post an image when I find out how to make window screen shots on a PC and where the shots gets filed (unfortunately I'm a devoted Mac user)....
Edit: is it also P-Channel specific in your case or do you also see it on N-Channel devices?
Last edited:
Also with NMOS, but much more reproductible. The last erratic point is always the same. I can see the overcurrent LED light up so I'm assuming this is linked to the current limiting circuit.
Below is the result for a SemiSouth power JFET (R100). All erratic points line up perfectly (there are several measurements there):
Below is an IRFP240:
Below is the result for a SemiSouth power JFET (R100). All erratic points line up perfectly (there are several measurements there):
Below is an IRFP240:
I see those you have shown in the post above when the current "roof" is reached and they are definitely caused by current limiting circuit. Possibly because another measurement is taken after the current has been turned of.
What I observe happens about 1.5A below the current limit.....
What I observe happens about 1.5A below the current limit.....
Complementary N and P-Channel mosfets.......

looks like my etch a sketch graph
")
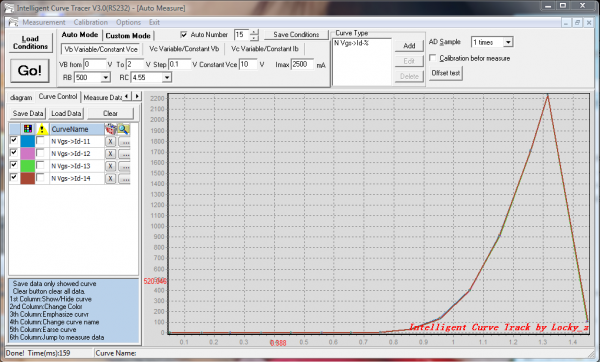
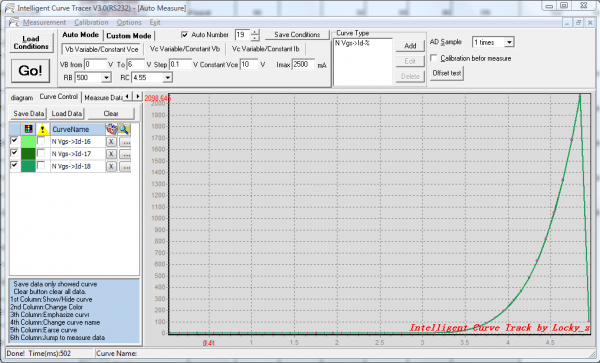
I think the E-Channel power amplifier become not stable at large current.
The curve tracer‘s measurement is based on the ’VE‘ can not be changed.
VE output by the E-channel power amplifier guaranteed. Instability may have two kinds of situation,one is the output oscillation, one is the output voltage drop increases.
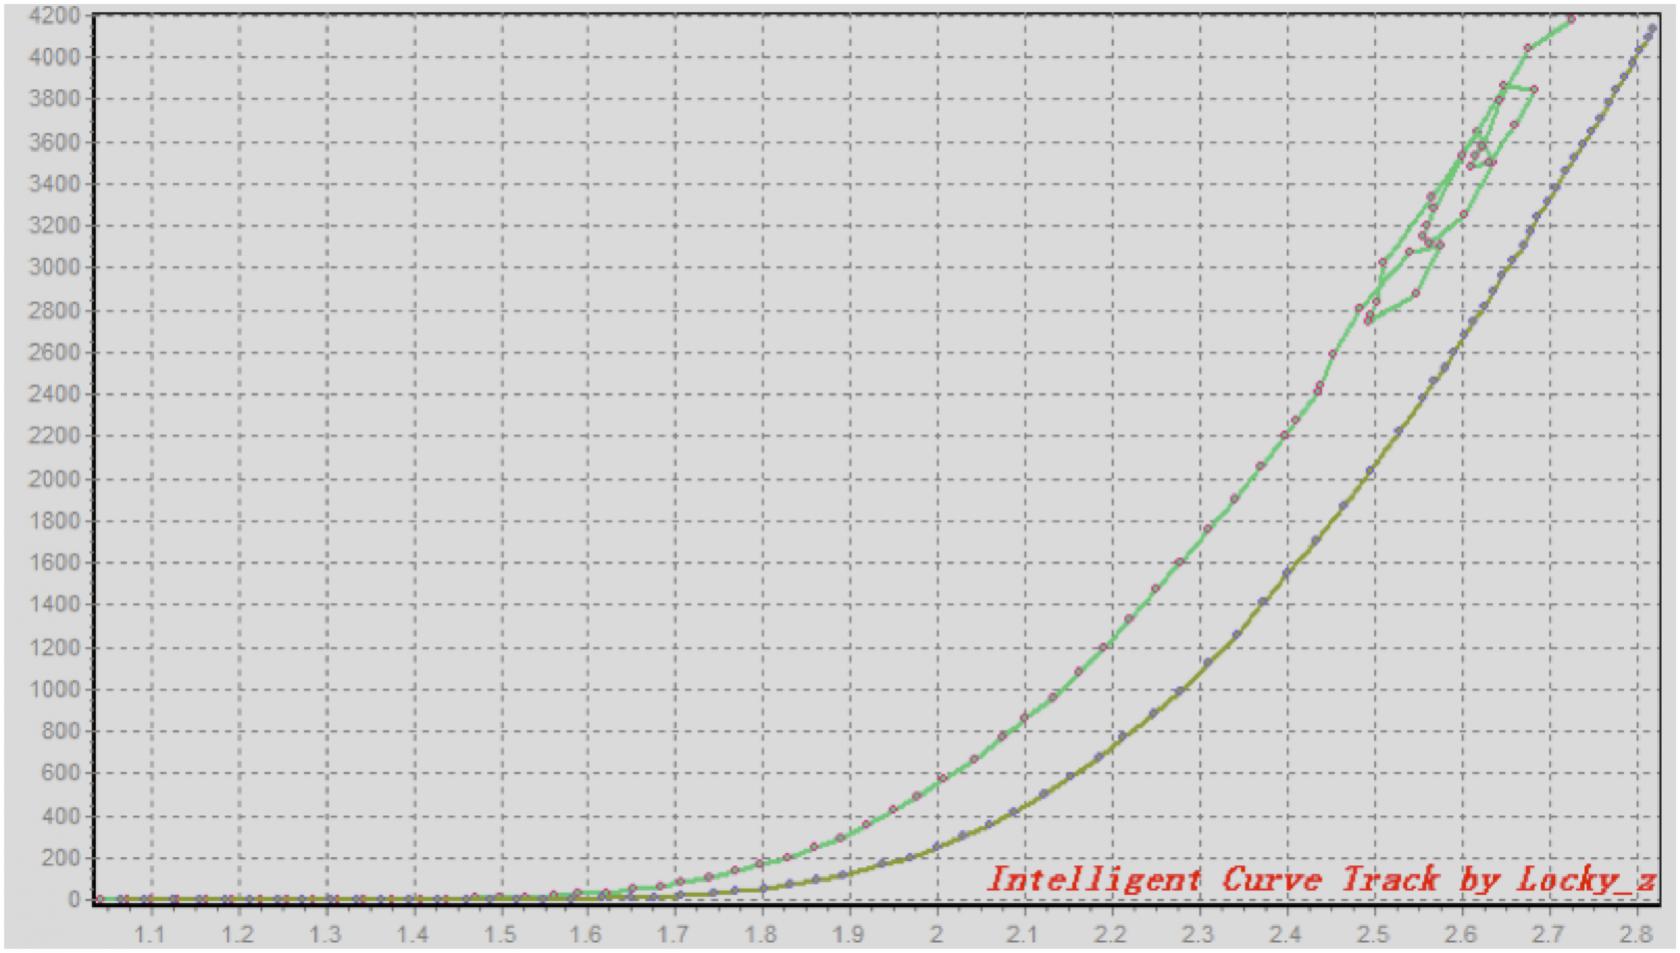
From the gray curve, You can see each point interval narrowing when current more than 2.4A.
This may be E-channel power amplifier output voltage drop increases.
You can view the measure data in the form of the curve, Observed 'Ve' column.
When the current increases, 'VE' value will increase.
Because Vgs=Vb-Ve, Vb increase->Id increase->Ve increase->Vgs reduce,so you see the interval narrowing.
'The power amplifier output voltage drop' control by the paramater 'options->Config‘->Voltage Drop(sink) & Voltage Drop(Source).
When measure N-type DUT, the E-Channel power amplifier is sink current,so the 'sink' parameter control this.
When measure P-type DUT,The E-Channel power amplifier is source current,so the 'source' parameter control this.
But the Green curve like 'sketch',I think it may be oscillation. you also observed 'Ve' column in the form data that the current more than 2.3A.
If the VE is a monotonically increasing or descending, then it is the ‘voltage drop’.
If the VE is random changes, then it is the oscillation.
If it is oscillation, may need replace the LM358 or TIP132/TIP137.
Hem
How do you mannage to post so nice charts as pictures.
May need very dumb explanation by the way
When you get the curve,You can right click in the curve region and choose 'copy Image to clipboard', and open run the ‘brush’ and paste.
Where is the link to download the software?
Here version 2
http://www.diyaudio.com/forums/solid-state/151253-diy-curve-tracer-pc-4.html#post2213207
Got mine up and working. Still figiring it out. Excellent from what i have experienced. Thanks LockyZ
Told you so...
Tanks for pointer to clip board one more thing I need to learn...
that works for charts I will need to figure out whole screen with set ups.
Carpin mention software version 2 and link just take back to tread.
I am not shure of what version I have
Is there a new one ?
- Status
- This old topic is closed. If you want to reopen this topic, contact a moderator using the "Report Post" button.
- Home
- Amplifiers
- Solid State
- DIY Curve Tracer for PC