i just started learning to use Xsim, it's easy and fun to learn. but I'm lack of having frd or zma files from the driver that i want to simulate. Somehow i landed on this page
FPGraphTracer : fprawn labs
"FPGraphTracer is a simple, easy to use, tool for automatically tracing lines in a graph to extract the data it represents. Originally intended for the DIY speaker community, it outputs in the FRD/ZMA text based format used by many speaker designing programs, which can also be pasted directly into most Spreadsheet software"
long time ago, i have tried manual tracing from manufacture frequency response curve, copy it to xls file and estimate SPL based on Freq. this is manual sampling but it's very hard and boring to do to match with datasheet.
I have abandoned this method and now i'm surprised to find this wonderfull software which fulfill my needs. you can read the manual on the page, but I'd like to share my experience here, hopefully it's useful
1. find manufacturer frequency response curve in high resolution, i prefer pdf file instead of jpeg.
2. convert pdf to to png (many free website to do this for free). this why step 1 for pdf is better because JPEG file has dirty image around the line. the "white" on the screen you see, when you zoom it will show many artefact
3. load png file from step 2 to FPGraphTracer, click 8X zoom button and zoom to the line that you want to trace. once you click it, look at the trace that it created (usually in pink line). if you find it hard to get a good curve tracing compared to datasheet, go to step 4.
4. edit the png and clear any dots around the curve that you want to trace, the purpose is to get a clean curve without any artefact. I do this using MS Paint, zoom it to max 800% and start Erasing pixel by pixel
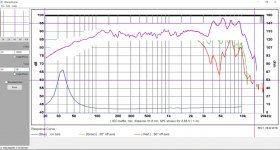
this is my project to trace SB17NRX, all artifact around the curve have been cleaned. started from Axis response
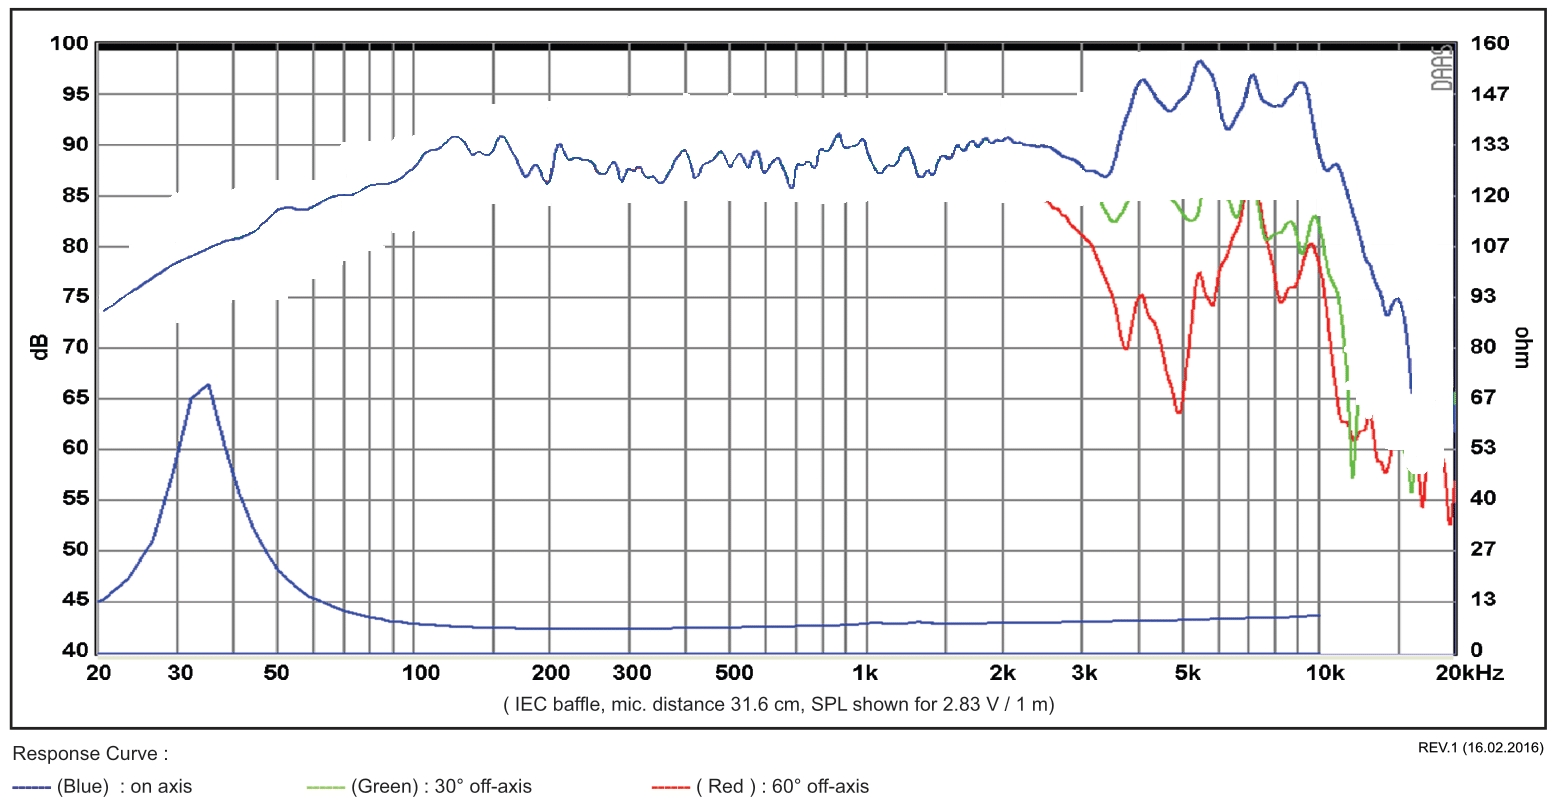
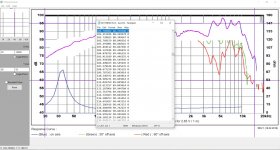
5. repeat step 3, move vertical and horizontal pink line to match with graphic and set X and Y axis min/max on left menu. my below example, vertical line is set to 60 and 95 (this is for SPL) and horizontal line to 20 and 15000 (this is for Freq). then save to .frd file. there are 3 group of data, first is Freq then followed by SPL and followed by Angle
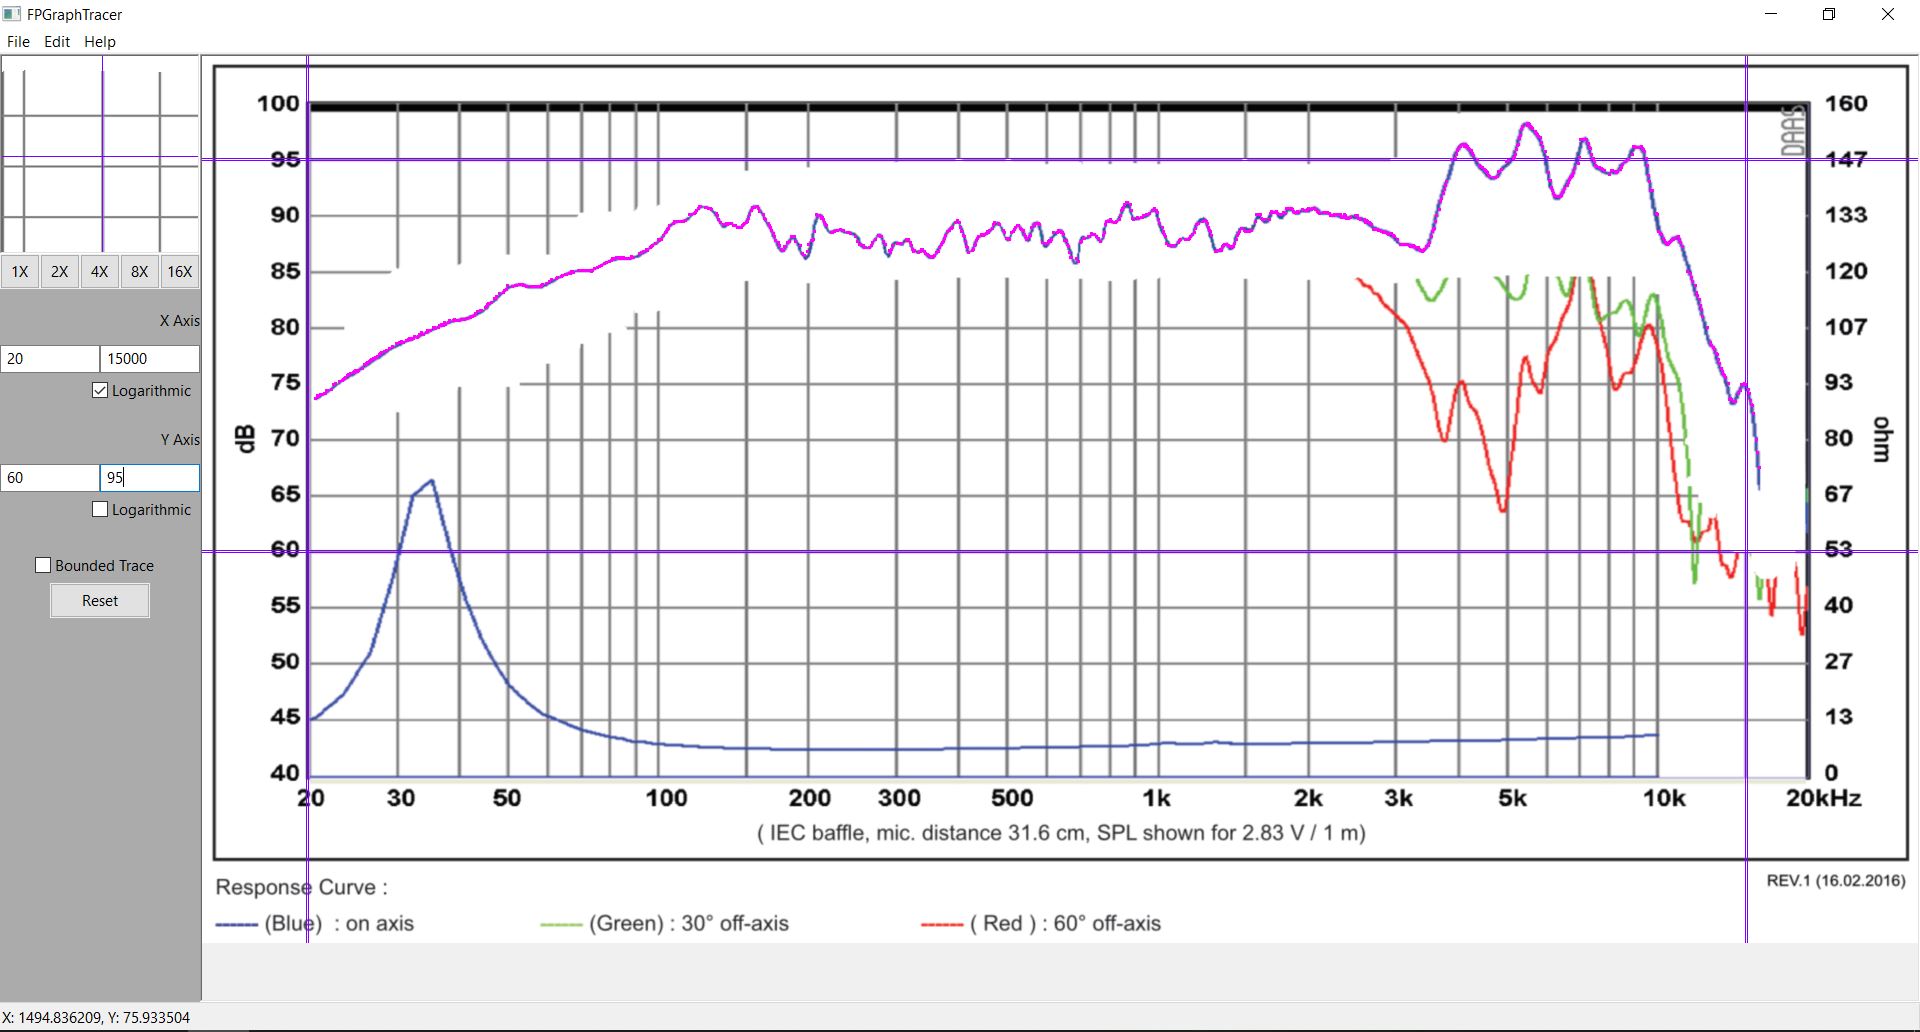
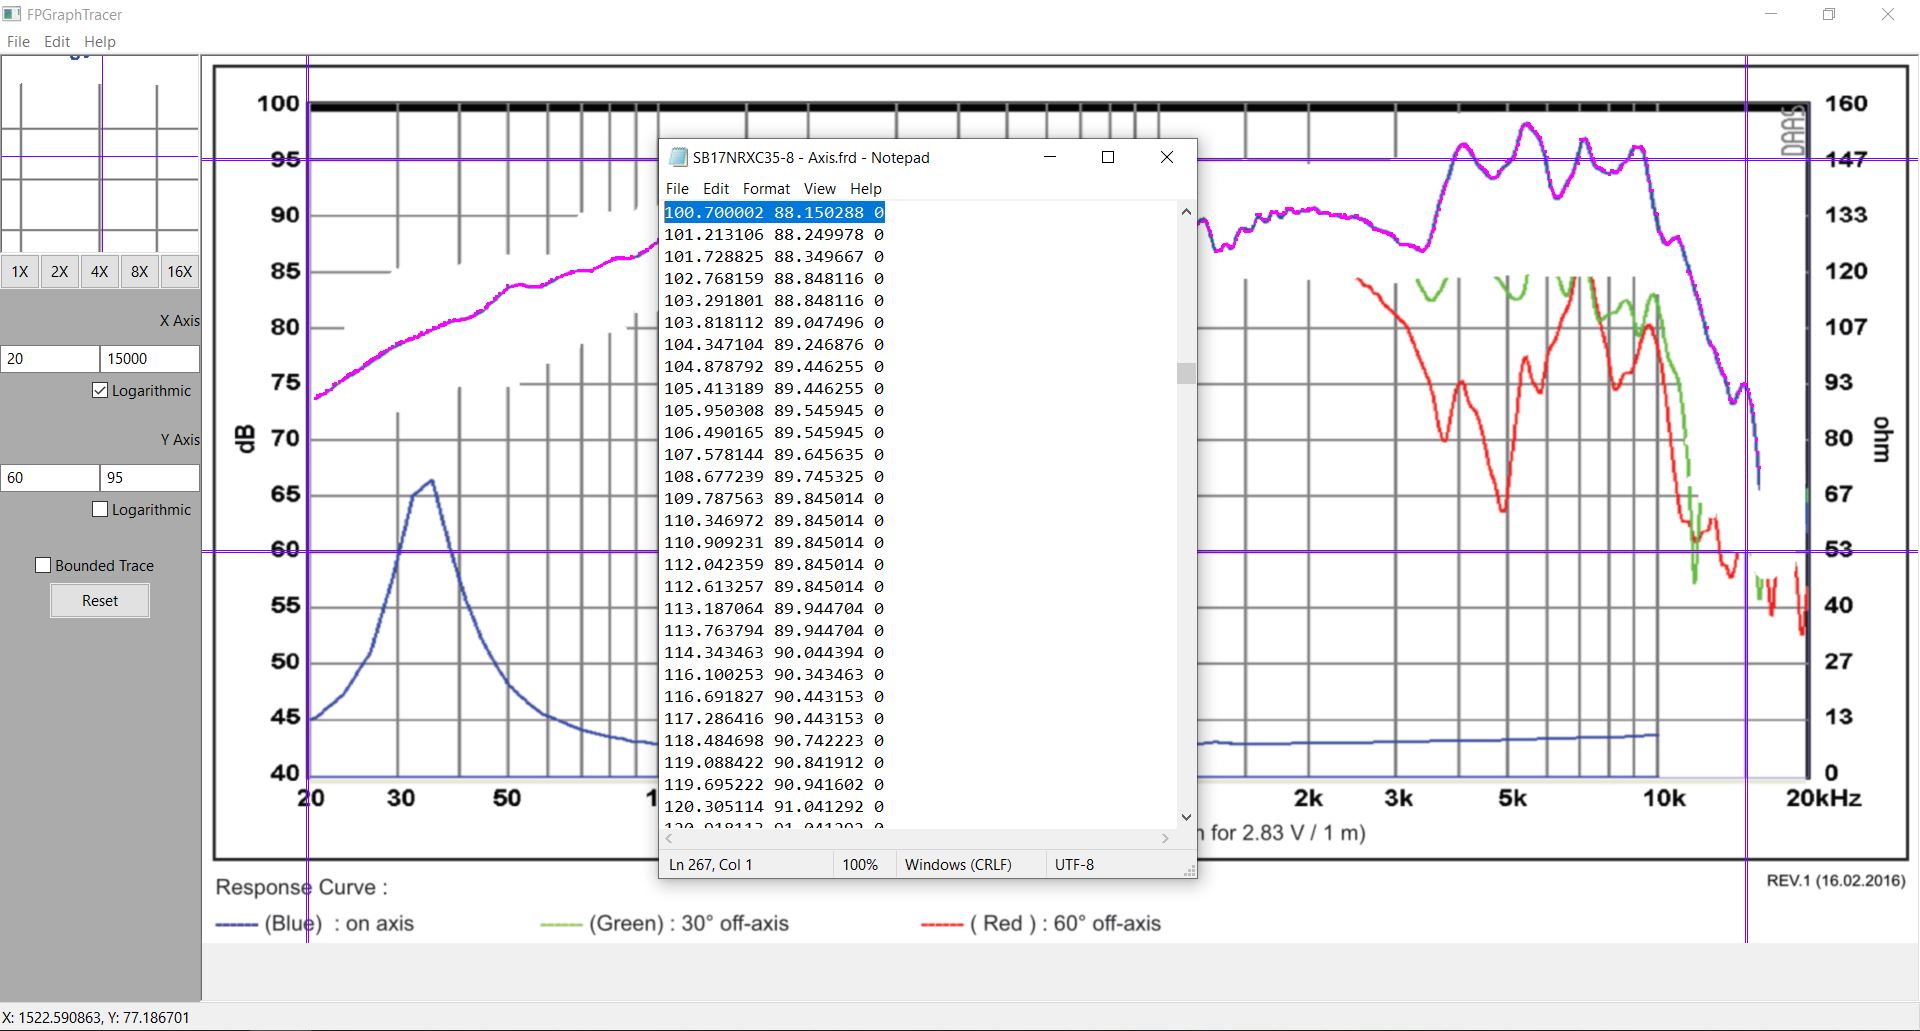
6. data verification, this is the most important step. open frd file using Notepad, choose any Freq point on graphic and compare to the number on frd file. my below example is : choose 100Hz point and check on number that is shown as 88 which verified by my eyes to the graph is around that, mission passed. you can sample as many point as you need
FPGraphTracer : fprawn labs
"FPGraphTracer is a simple, easy to use, tool for automatically tracing lines in a graph to extract the data it represents. Originally intended for the DIY speaker community, it outputs in the FRD/ZMA text based format used by many speaker designing programs, which can also be pasted directly into most Spreadsheet software"
long time ago, i have tried manual tracing from manufacture frequency response curve, copy it to xls file and estimate SPL based on Freq. this is manual sampling but it's very hard and boring to do to match with datasheet.
I have abandoned this method and now i'm surprised to find this wonderfull software which fulfill my needs. you can read the manual on the page, but I'd like to share my experience here, hopefully it's useful
1. find manufacturer frequency response curve in high resolution, i prefer pdf file instead of jpeg.
2. convert pdf to to png (many free website to do this for free). this why step 1 for pdf is better because JPEG file has dirty image around the line. the "white" on the screen you see, when you zoom it will show many artefact
3. load png file from step 2 to FPGraphTracer, click 8X zoom button and zoom to the line that you want to trace. once you click it, look at the trace that it created (usually in pink line). if you find it hard to get a good curve tracing compared to datasheet, go to step 4.
4. edit the png and clear any dots around the curve that you want to trace, the purpose is to get a clean curve without any artefact. I do this using MS Paint, zoom it to max 800% and start Erasing pixel by pixel
this is my project to trace SB17NRX, all artifact around the curve have been cleaned. started from Axis response
5. repeat step 3, move vertical and horizontal pink line to match with graphic and set X and Y axis min/max on left menu. my below example, vertical line is set to 60 and 95 (this is for SPL) and horizontal line to 20 and 15000 (this is for Freq). then save to .frd file. there are 3 group of data, first is Freq then followed by SPL and followed by Angle
6. data verification, this is the most important step. open frd file using Notepad, choose any Freq point on graphic and compare to the number on frd file. my below example is : choose 100Hz point and check on number that is shown as 88 which verified by my eyes to the graph is around that, mission passed. you can sample as many point as you need
Attachments
Last edited:

How to create zma file?
the steps are the almost same as below:
- you get a clean curve on Impedance line
- clean any artefacts around the line using MS Paint
- load it to the software and change Y value based on Impedance on right Y axis (in Ohm) on response curve (not SPL)
- save the file as .zma
- verify the numbers
done. now you can have your own database
Thanks gadut and Kotter. This is from the multi-way sticky thread.
Favorite Threads and Posts in "Loudspeakers"
Favorite Threads and Posts in "Loudspeakers"
Member
Joined 2003
FWIW all your tracing desires can be accomplished with the tracing tool within VituixCAD. There is also this very functional graph tracer website that requires no software other than your browser to operate:
WebPlotDigitizer - Copyright 2010-2021 Ankit Rohatgi
WebPlotDigitizer - Copyright 2010-2021 Ankit Rohatgi
Where would I set the lower limit for the impedance axis (vertical)?
In the picture I've set it to 1 ohm but I know that's not correct. Problem is 4 is too high (impedance drops to 3 ohm). Setting to 0 gives an error when I try to load the file. And dropping the border on 0 and setting the value to 0.001ohm results in a clearly incorrect trace.
In the picture I've set it to 1 ohm but I know that's not correct. Problem is 4 is too high (impedance drops to 3 ohm). Setting to 0 gives an error when I try to load the file. And dropping the border on 0 and setting the value to 0.001ohm results in a clearly incorrect trace.
Attachments
Member
Joined 2003
What am I doing wrong? I keep getting a nearly flat impedance curve when i open the file in Xsim. View attachment 1012178
- try to set Y axis from 0 not 6.7
- open exported file using notepad and verify the numbers, or copy that into xlsx and plot the result
either it's wrong when you export it or issues with Xsim
- Home
- Design & Build
- Software Tools
- FPGraph Tracer : great software to create FRD or ZMA file from graphic response curve