Two questions as I try to remember what I forgot in the last 10 years:
In the error report, for each of the two nodes I listed, it provides as I requested, all 9 harmonics and a total, But there is a second value in paren. What is this value?
N-Period=all
Fourier components of V(vout)
DC component:-0.0021609
Harmonic Frequency Fourier Normalized Phase Normalized
Number [Hz] Component Component [degree] Phase [deg]
1 2.000e+04 2.978e+01 1.000e+00 -5.44° 0.00°
2 4.000e+04 2.388e-04 8.019e-06 -54.43° -48.99°
3 6.000e+04 7.264e-04 2.440e-05 -156.21° -150.76°
4 8.000e+04 1.038e-05 3.486e-07 25.32° 30.77°
5 1.000e+05 8.032e-05 2.697e-06 -77.23° -71.79°
6 1.200e+05 3.249e-05 1.091e-06 -26.49° -21.05°
7 1.400e+05 5.559e-05 1.867e-06 16.90° 22.35°
8 1.600e+05 1.800e-05 6.046e-07 -4.94° 0.51°
9 1.800e+05 1.520e-05 5.103e-07 138.94° 144.38°
Total Harmonic Distortion: 0.002593%(0.014511%)
Second question. Running current version XVII October 2020. Be darned if I can find the function that displays the spectrum. Not in the view traces. Do I have something turned off or hidden?
2nd parameter is THD with all theoretical harmonics included; see What's LTspice doing there? for more info, including a comment from Mike Engelhart himself.
To display the fft spectrum, go to the waveform window, right-click, and select View FFT.
To display the fft spectrum, go to the waveform window, right-click, and select View FFT.
Last edited:
Ah, thanks. Implies harmonics over 9. I wil play with that.
But, I find no View FFT anywhere. In View/Visible traces, I only have the voltages and currents on all the devices to select from. Am I missing a directive that saves such information? Even "Help" says "built into waveform viewer" but no FFT. If I click in a displayed waveform, I get the same select box, but curiously there is a name "time" that is not there when I click on visible waveforms.
Under Window, it is just how the tiles are laid out.
I wonder if I missed something as it is an upgrade to an upgrade... not a clean install?
Made good progress. Molly's sticky helped.
Now here is another question. By getting to finer resolution I can get a prettier FFT display. But it takes forever. I did a run last night that took almost an hour. OK, that is a lot of multiplying, but why is it taking less than 25% of my computer? Should it not be maxing one core ( assuming a single threaded program, which by todays standards in pretty sad) It runs 12 to 13%.
I did notice the end result as far as measurement goes in no more accurate at the high resolution than when it runs in 30 seconds.
I haven't used the new version, but IV has an option for setting how many threads. I set it to the number of cores I have.
It's on the spice tab in control panel in IV.
Again this is IV but I would assume the new one is the same, anywhere in the waveform window right mouse click and a menu should pop up, down the botton is view, move over that and there should be FFT and Error log.
Tony.
It's on the spice tab in control panel in IV.
Again this is IV but I would assume the new one is the same, anywhere in the waveform window right mouse click and a menu should pop up, down the botton is view, move over that and there should be FFT and Error log.
Tony.
Attachments
Last edited:
Was set at 8 cores. I set the priority to high. Still only 12 to 13%.
For some reason, it was not switching the button for "view" when I clicked the window. It is now. My other bug is it insists I have multiple definitions for all the components. I verified I don't. My libraries I exported into Excel, added all the extra ones form various vendors and Cordell, sorted so I can actually find one, and exported back as text. A lot of work, but much easier to use.
For some reason, it was not switching the button for "view" when I clicked the window. It is now. My other bug is it insists I have multiple definitions for all the components. I verified I don't. My libraries I exported into Excel, added all the extra ones form various vendors and Cordell, sorted so I can actually find one, and exported back as text. A lot of work, but much easier to use.
Found the answer. Turns out the majority of processes are by definition sequential,
and therefor single threaded. So it is using all of a single virtual core. What that means is I wont slow it down looking at my mail while it is running but it is not goin to run any faster.
Been testing various parameters. For my analog amplifiers, looks like about 100 cycles and .01us resolution gives a reasonable visual graph but does so at a reasonable time. Time for just under whatever 100 cycles takes.
The FFT option is in the 'View' menu but only active when you have the '.RAW' window active after you have run a simulation.
In other words, run your simulation, select your output node on the .ASC window for the sine wave, click on the '.RAW' window somewhere to make it active, then go to the VIEW...FFT option.
By the way, I usually use this:
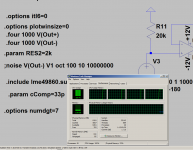
.options plotwinsize=0
.options numdgt=8
.param freq 1k
.param num_fft_pts 4096
.param timestep {1/{{freq} * {num_fft_pts}}}
.four {freq} 19 8 V(vout)
.tran 0 {15/freq} {2/freq} {timestep}
P.P.S: This tool is really useful for visualisation:LTSpice Fourier viewer ( graphically )
In other words, run your simulation, select your output node on the .ASC window for the sine wave, click on the '.RAW' window somewhere to make it active, then go to the VIEW...FFT option.
By the way, I usually use this:
.options plotwinsize=0
.options numdgt=8
.param freq 1k
.param num_fft_pts 4096
.param timestep {1/{{freq} * {num_fft_pts}}}
.four {freq} 19 8 V(vout)
.tran 0 {15/freq} {2/freq} {timestep}
P.P.S: This tool is really useful for visualisation:LTSpice Fourier viewer ( graphically )
Last edited:
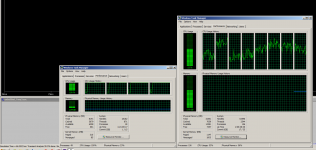
That is weird about the sequential, my IV uses all four cores to 100% when the sim is running). I have four cores dedicated to my virtual machine, of 8 cores on my laptop (I think the laptop has four physical cores but shows 8 due to hyperthreading).
You can see it is using 50% CPU on the real hardware.
I wouldn't have thought the new version would be a backward step in being able to utilize the hardware..
Tony.
You can see it is using 50% CPU on the real hardware.
I wouldn't have thought the new version would be a backward step in being able to utilize the hardware..
Tony.
Attachments
AC and noise seem to be almost instant on my machine. The screenshot shown is for transient analysis with fourier statements.
I'm wondering if you have a problem with the particular circuit you are simulating. Sometimes I see spice running extremely slowly and often all that is required is changing a resistor value a little, or perhaps a cap. Sometimes things just seem to get hung up.
Tony.
I'm wondering if you have a problem with the particular circuit you are simulating. Sometimes I see spice running extremely slowly and often all that is required is changing a resistor value a little, or perhaps a cap. Sometimes things just seem to get hung up.
Tony.
- Status
- This old topic is closed. If you want to reopen this topic, contact a moderator using the "Report Post" button.
- Home
- Design & Build
- Software Tools
- LTSpice THD in error report second result