Thanks...I bumped into this video
Nice to be able to help, the video is the first hour of the seminar, I assume the other 5 cover the whole presentation.
I'm a bit surprised Mike made the sparse matrix one of his 3 differentiators, which implies Pspice doesn't use it.
I think his point is that LTspice makes efforts to reduce the matrix size to less than PSpice.
For instance, LTspice will reduce the matrix if the series resistance of a capacitor is part of the capacitor specification rather than added as an explicit component.
It's a concept widely used in the computer field for the last 20 years or so, especially in databases...
More than 20 years...database was my profession
")
Best wishes
David
Last edited:
Hi David,[...]
Does Microcap have a VDMOS model for power FETs? That would be a deal-breaker for audio power amp simulations, to me.
I've two of them: 2SK1530 and 2SJ201.
See: CFA Topology Audio Amplifiers
Cheers, E.
I've two of them: 2SK1530 and 2SJ201. See: CFA Topology Audio Amplifiers
Hi Edmond, nice to catch up with you. Your hand coded sub-circuit version of a VDMOS model for Microcap is impressive but looks like a lot of work compared to the native model in LTspice. My LTspice VDMOS models were pretty simple to do but came out quite accurate. Also Mike added temperature coefficients in LTspice just a day after I asked him, which was very responsive.
I am a little surprised you didn't pick up on this comment.
You and Ovidiu did so much work to break 1 PPM when apparently it should be easyWith lateral mosfets it's easy to get 0.05 ppm (20 KHz) and ~-160 dB IMD (1.9 & 2.3 KHz) at up to 200 W...
Best wishes David
Last edited:
Hi David,[...]
My LTspice VDMOS models were pretty simple to do but came out quite accurate.
Also Mike added temperature coefficients in LTspice just a day after I asked him, which was very responsive.
I am a little surprised you didn't pick up on this comment.[
[...]
Best wishes
David
Just busy with other things (DiAna and ....... tubes
 ).
).Cheers, E.
You don't have to. The "cd" version is self-contained: just unzip it somewhere and run mc12.exe or mc12_64.exe from there. No installation, no dll, no messing with the registry, etc... The setup.exe is optional.
For me, this is a big plus: I still have my fully functional LTspice installation alongside for a smooth transition, if any.
Indeed. Also the downlaoded uC12 is portable, if you have installed it on one computer it's enough to copy the entire folder to another system and eventually change file paths via the "options" menu. It's quite likely to run under Linux (via Wine) as well.
[...]
You and Ovidiu did so much work to break 1 PPM when apparently it should be easy
Best wishes
David
My work resulted in 1970s topology amps ( = few components) below 1 ppm, and things can't get any simpler than that
...
More than 20 years...database was my profession
...
David
Maybe 10 years ago, I (jokingly) coined the catchphrase "Instant BI: Just Add Numbers", in reference to the Asian instant noodles (just add water). The backend entirely relied on sparse matrices. But the marketing guys didn't buy it...
So I should learn it? I also just switched to LTspice two years or so ago...
Jan
Yes you should
Maybe the best (fastest) way to learn a bit of what the program can do is to visit the Micro-Cap Newsletter site.
It's filled up with a lot off information. I would suggest that you download all the Newsletter pdf. files and the Newsletter files ( the newsletter files are MC files that you unZip (store them in a folder inside the MC12 folder) and open them in MC12). Every Newsletter have a lot of articles an tips about simulation with MC.
There is also a search window on that site so you can search the newsletters.
As an example: If you search "Tian" you will get two Newsletter articles, one from spring 2011 "Plotting Loop Gain Using the Tian Method" and one from fall 2013 "Stability Analysis" Read the articles, download and unzip the spring 2011 and fall 2013 files, open them in MC and run the simulation.
The 2011 file is an "AC" analysis (in the drop down window)and the 2013 file is a "Stability" analysis (in the drop down window) the "Stability" analysis will also show a Nyquist diagram on its own page in the Simulation result window.
Good luck
Stein
My work resulted in 1970s topology amps...below 1 ppm
Your earlier 0.05 PPM claim is about a factor of 20 better than circuits that required a lot of complexity, and work, from very skilled people. Below 1 PPM is also 20 to 100 times better than any simple 1970s circuit I have ever seen tested or published So either you have an unrealistic simulation or have achieved an incredible breakthru that has somehow been overlooked by every amplifier expert for the last 50 years. I would love to see this, can you post the simulation?
Best wishes David
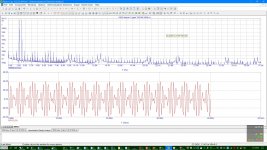
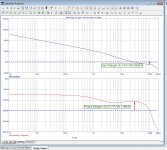
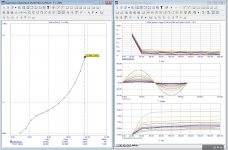
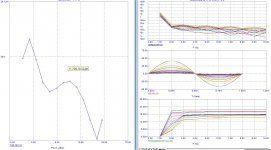
I checked my audio folders and it appears that I've been working on power amps almost daily, since 2013 (time flies). My initial designs with those simple topologies were at best in the 0.0X % range and improvement was slow until several months ago I applied some additional rules for lowest distortion. I'll have to verify if such a low distortion can be realized in practice, by constructing and measuring. The simulation pics regard THD (20 KHz), stability and IMD (1.9 & 2.3 KHz).
Attachments
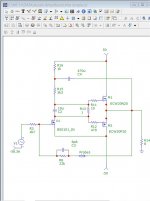
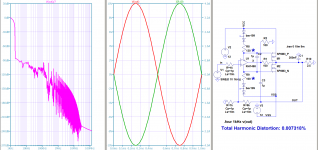
My pleasure. The circuit below has just 3 mosfets and yet simulates at ~ 100W (8R) with 0.025% THDmax - 1 KHz. Because of that and the simplicity, you could convert the amp to a practical one for single supply. Find out why THD at low level is higher than at maximum output.Can some user of MC Kindly post MC files of simple audio amps as an exercise for beginners? The learning curve will be easy to scale !
Dear Aridace, can you kindly help ?
Attachments
Can some user of MC Kindly post MC files of simple audio amps as an exercise for beginners? The learning curve will be easy to scale !
Dear Aridace, can you kindly help ?
That would have been one of my requests as well had I decided to use it.
My pleasure. The circuit below has just 3 mosfets and yet simulates at ~ 100W (8R) with 0.025% THDmax - 1 KHz. Because of that and the simplicity, you could convert the amp to a practical one for single supply. Find out why THD at low level is higher than at maximum output.
And I think gannaji actually meant a 'click to run' file like a .asc for LTspice and that is what I understood can not be done with MicroCap.
I've been comparing the uC and LTspice syntax. LTspice has much more functions for dependent sources. Also, uC has no ".Four" directive (Fourier analysis, not FFT).
For nonlinear inductances, LTspice has a Chan hysteresis model. Also, LTspice has the correct, branded operating amplifier models, in which the output current enters the power supply circuit. This makes it possible to control the output transistors by using currents through the supply pins. Here is an example:
For nonlinear inductances, LTspice has a Chan hysteresis model. Also, LTspice has the correct, branded operating amplifier models, in which the output current enters the power supply circuit. This makes it possible to control the output transistors by using currents through the supply pins. Here is an example:
Attachments
Thanks, this works well. But LTspice is good too. I will use both.Full version (not evaluation version) 12 is available for download and installation for free.
mlloyd1
The simulation appears to show 2 PPM at 20 kHz and 200 W.... The simulation pics...THD (20 KHz), stability and IMD (1.9 & 2.3 KHz).
But you wrote
So these results are 40x worse than your claim. Can you show any 0.05 PPM simulation? Very curious to see the Tian probe plot, it should be spectacular....it's easy to get 0.05 ppm (20 KHz)...at up to 200 W.
Best wishes
David
You might need (better) glasses or a visit to an ophthalmologist. The vertical scale on the THD graph is in units of u% - MILLIONTH OF 1%. That equals a scale of 10^-8 per unit or 10 ppb (parts per billion, not million). You could have realized that by reading the IMD graph with vertical scale in powers of 10.
Can some user of MC Kindly post MC files of simple audio amps as an exercise for beginners?
If you go to the File menu and select Open you will see that it comes with a lot of sample files, including a folder of audio amps. There are Hiraga, JLH, Curl, Leach and other amps in there.
Last edited:
- Status
- This old topic is closed. If you want to reopen this topic, contact a moderator using the "Report Post" button.
- Home
- Design & Build
- Software Tools
- LTSpice vs Micro-cap. There both free now, whats the difference?