You might try adding a 1uF cap to AC couple it and see if that helps. I have had strange behavior sometimes when using the sound card’s own audio output to drive the amp under test. In which case, a standalone unit like Akitika eliminates that. Some sort of feedback issue.
That’s very cool that you have a Lotus and you get to take it on a track. Is this a Lotus 7?
I only get to race on a simulator but have tried several different Lotuses and they are all wonderfully nimble balanced cars to drive.
That’s very cool that you have a Lotus and you get to take it on a track. Is this a Lotus 7?
I only get to race on a simulator but have tried several different Lotuses and they are all wonderfully nimble balanced cars to drive.
22dbu or 10V at minimum gain for solo.Another thing to mention about the UM2 is that the max input is 1V RMS. Mine seems to overload just shy of that. I wondered why everything I tested seemed to have the distortion go apeshit right around a volt.
Does anyone know the max input level from the Focusrite Solo?
However what you can do is to add an attenuator to control the input level. Unless you want to measure noise(still useless), you don't need much input level.
The proper way to measure noise is to make a clean 20db to 40db preamp run on batteries, and subtract the gain after it.
I do have an attenuator on the input, but wanted to know the distortion at various output levels and was hoping I wouldn't have to make some sort of voltage divider.
And how does this noise test setup work?
It's very common to see distortion at higher level. Most adc will have optimal distortion at around -20db, and will rise after -15db and may start to saturate after -6db.
The attenuator I meant was the voltage divider you mentioned. That's very common way to measure distortion if notch filter is over kill.
The noise setup is separate from the distortion measurement setup. Mentioned here http://www.ti.com/lit/ug/tidu016/tidu016.pdf
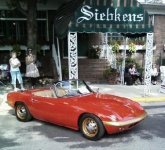
Beautiful car. I know you know, but most people do not realize that Colin Chapman, the founder of Lotus, is the inventor of the mid engine as stressed member F1 car layout that is still used today (over 50 years later). The Elan had a beautiful double “Y” backbone chassis. Car weighs only 1500lbs as I recall.
Ok, back to our regular programming.
Has anyone made measurements of their amps yet? I see mostly loopbacks posted here.
Ok, back to our regular programming.
Has anyone made measurements of their amps yet? I see mostly loopbacks posted here.
Last edited:
Looks good. You might try changing the plot and sampling. The plot is a little “ragged” looking as it is.
I have been traveling, but have sorted the loopbacks out for a Focusrite Clarett. Ready to hook up some amplifiers and do the RTA analysis of them.
That was without averaging and 87.5% overlap. With averaging and 50% overlap noise floor dropped.
I'm building a dual mono preamp (buffered - no gain) so this will be handy for THD and channel separation measurements. I'm still waiting for parts, I live 200km from the nearest city so all my shopping is online. Once I have it built I'll post the measurements.
Last edited:
I have the measurements for my B1 Korg Triode preamp using Behringer UM2, Akitika 1K generator and REW software. I was measuring and adjusting 2nd harmonic:
1 - 9.5 vdc at T7/T8 = 1.28%
2 - 10.24 vdc = 1%
3 - 11.56 vdc = 0%
4 - 12.4 vdc = 1%
1 - 9.5 vdc at T7/T8 = 1.28%
2 - 10.24 vdc = 1%
3 - 11.56 vdc = 0%
4 - 12.4 vdc = 1%
Attachments
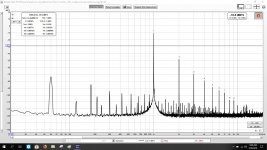
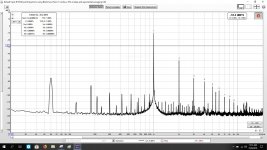
I rebuilt my Pass Labs B1 buffer here are the measurements. Nearly 120db down. Pretty happy
What version of REW are you uaing? It seems quite different from new version. And... it's actually more than -110db not almost -120db.
What version of REW are you uaing? It seems quite different from new version. And... it's actually more than -110db not almost -120db.
oops typing in the dark I just corrected it.
I'm using V5.00.
One thing that would be good to add is a peak search function for measurements for us with old eyes.
oops typing in the dark I just corrected it.
I'm using V5.00.
One thing that would be good to add is a peak search function for measurements for us with old eyes.
Peak search function? Like individual harmonics?
Press the THD button above the graph. May also want to update to the latest V5.20 beta version or the current V5.19 release.Yes. peak search with delta.
If you have used an Agilent spec analyser you can set one marker on the fundamental and the other searches for the next highest peak.
Try dBFS
Can you plot dBFS?
I rebuilt my Pass Labs B1 buffer here are the measurements. Nearly 110db down. Pretty happy
Can you plot dBFS?
Can you plot dBFS?
There is option in newer version to enable in dB.
RTA window - Gear setting button - Show distortion in dB
Press the THD button above the graph. May also want to update to the latest
I can see the THD is minuscule from the harmonic plot. And I forgot to press the THD icon, I'm not used to having the THD facility.
Can you plot dBFS?
The preamp is already back in the system . I'll be rebuilding the power amp soon so I'll do a dBFS plot then.
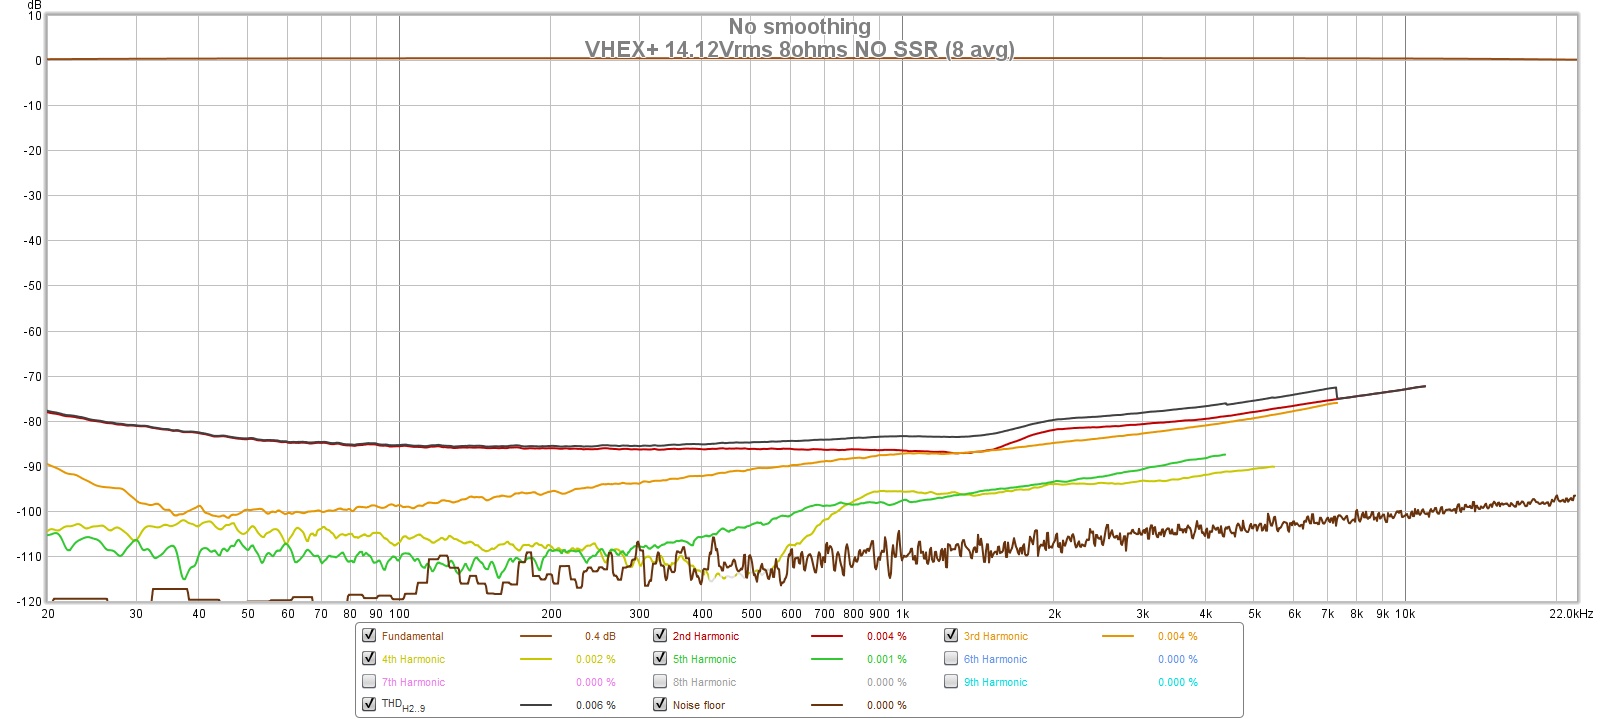
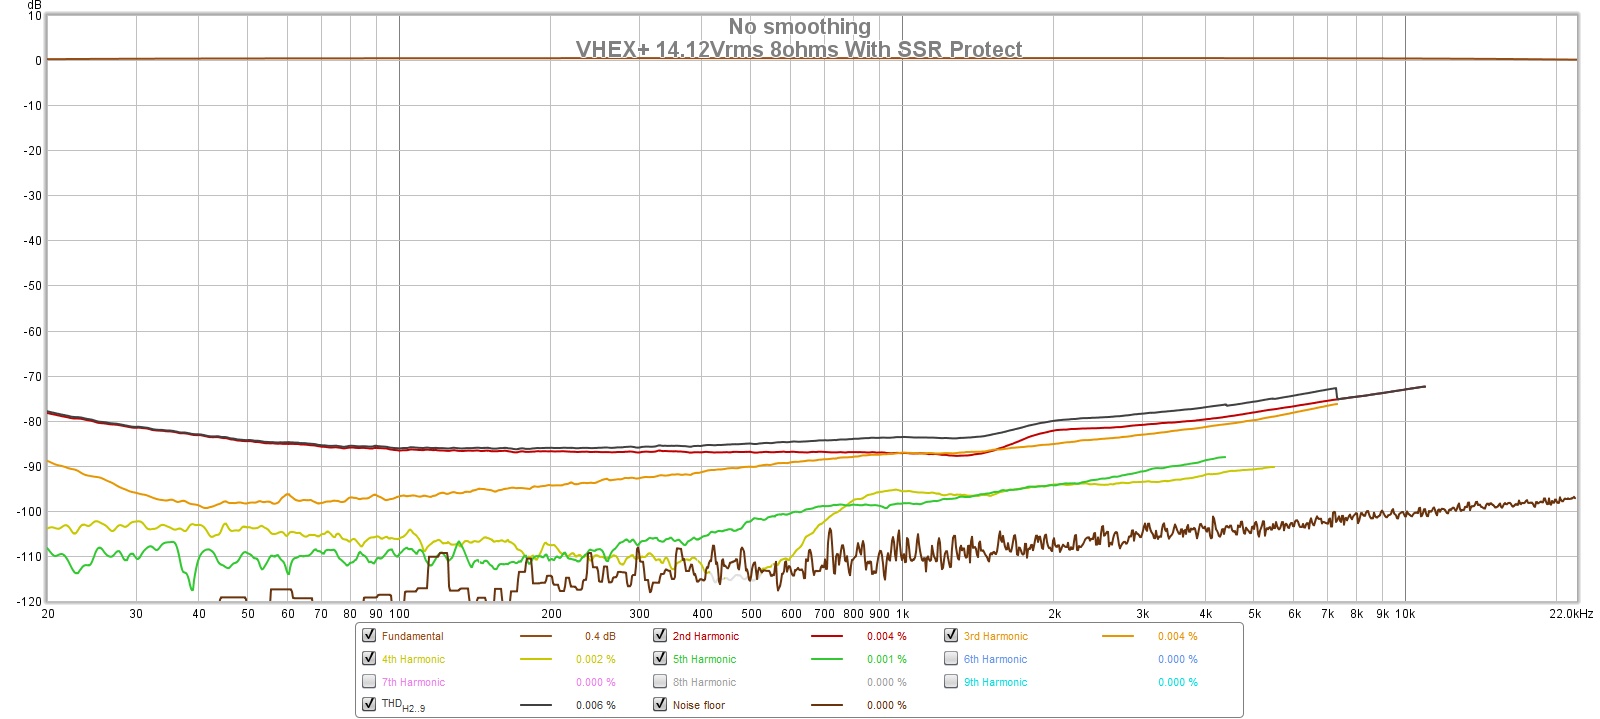
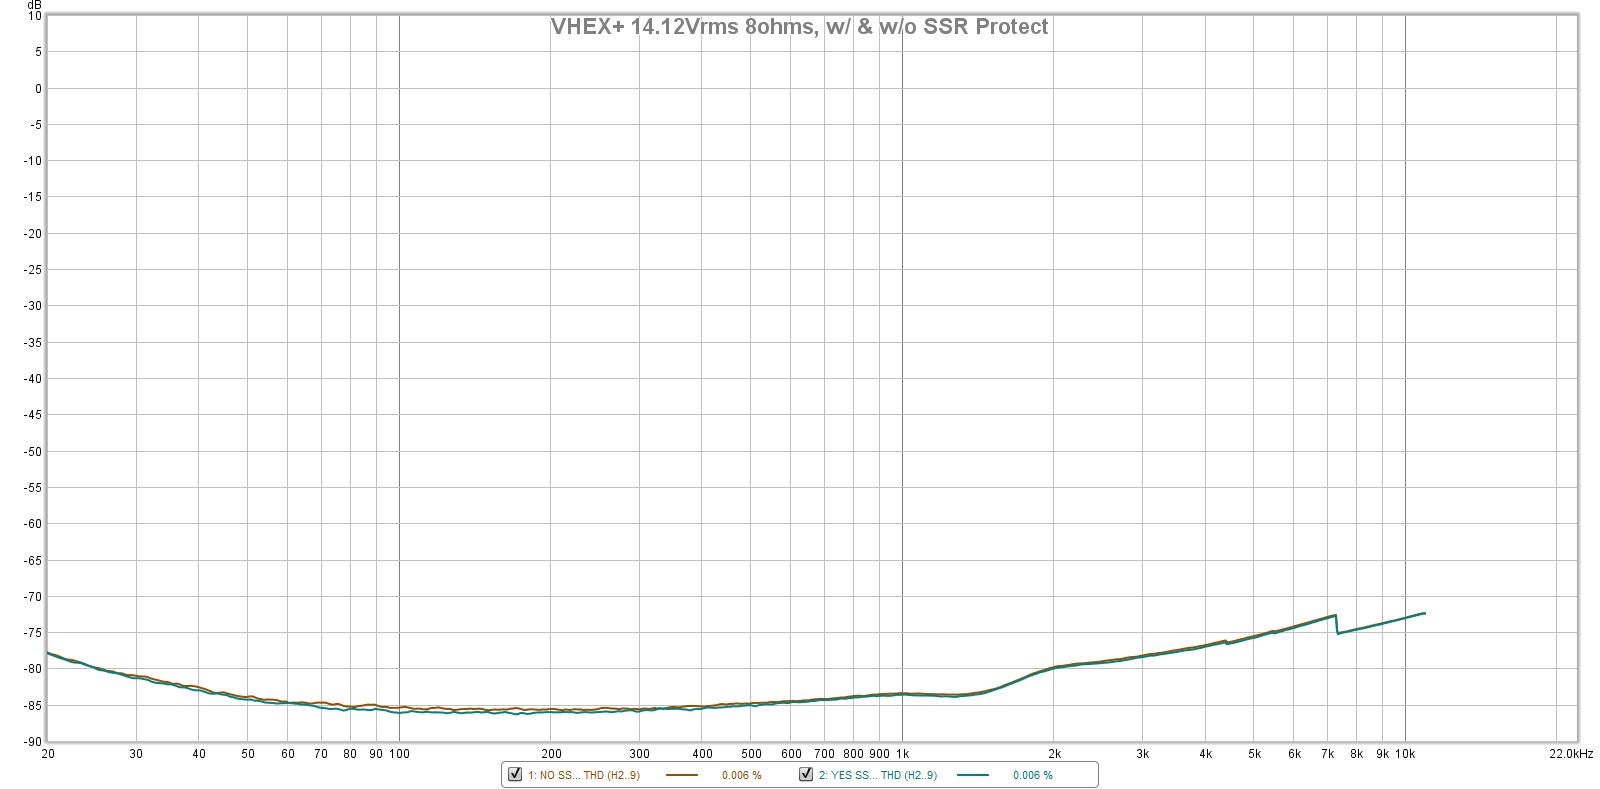
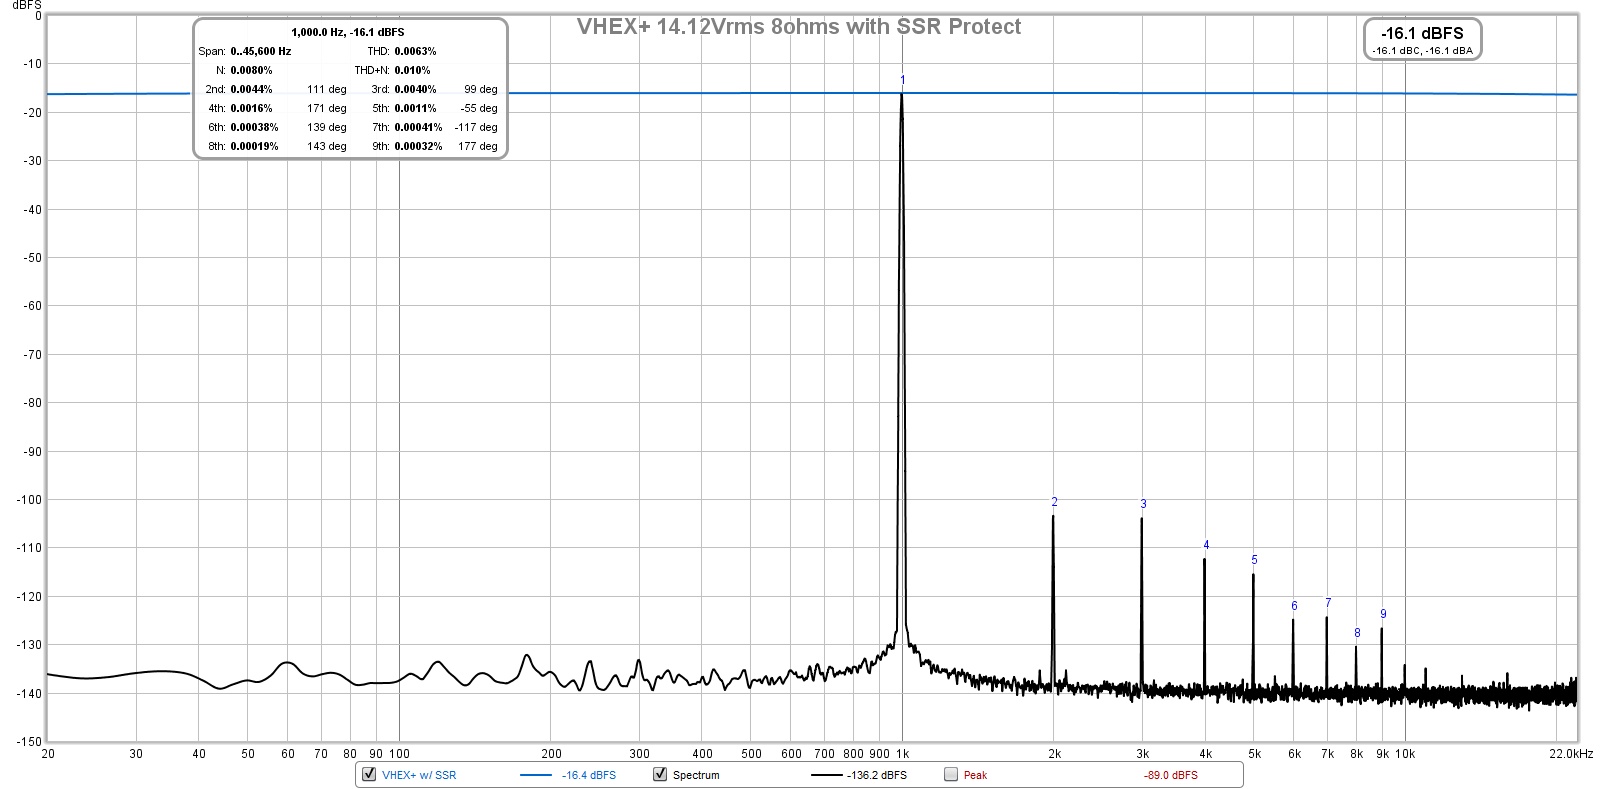
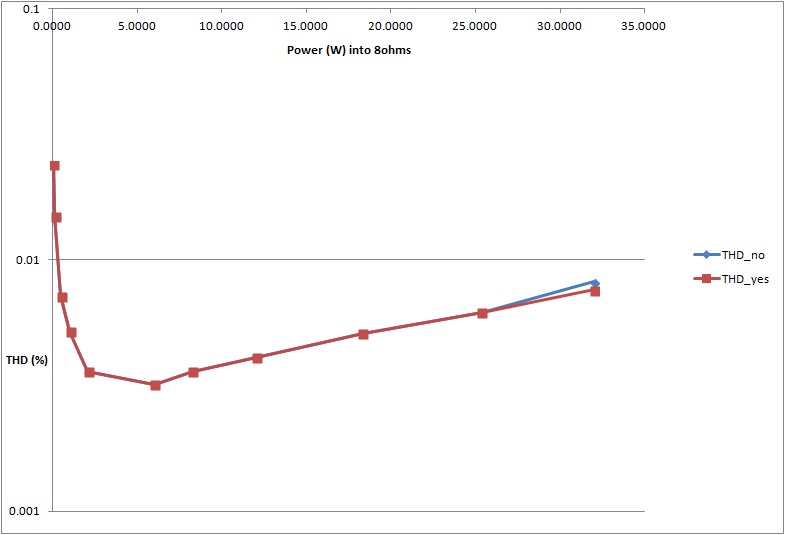
Some recent measurements I made in a VHEX+ Class AB amp. New here (for me) was using the sweep function to see behavior of components of distortion at different excitation frequencies from 10Hz to 20kHz. I also used the Plot Overlay function to compare the THD from two different sweeps on the same plot. I also looked at THD as a function of power into a dummy load. This was interesting as I did it for two cases (with and without a SSR DC protection circuit in place) and recorded the THD data manually into a spreadsheet and used that to plot the resulting graph.
Frequency sweep for no SSR (I used 1M data points and averaged 8bsweeps the get a nice smooth response and smooth estimate of the signal noise baseline):
Frequency sweep for with SSR in place
THD Overlay Plot:
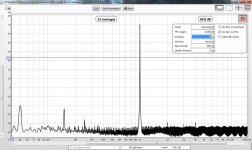
Typical FFT:
THD vs Power plot:
Here is the setup:
Tests conducted for 40Vpp into 8ohms (25wrms) - except for THD vs paper which used 65mW to 32W.
Ready-to-Run (RTR) SSR DC Speaker Protection and Delay GB
Frequency sweep for no SSR (I used 1M data points and averaged 8bsweeps the get a nice smooth response and smooth estimate of the signal noise baseline):
Frequency sweep for with SSR in place
THD Overlay Plot:
Typical FFT:
THD vs Power plot:
Here is the setup:
Tests conducted for 40Vpp into 8ohms (25wrms) - except for THD vs paper which used 65mW to 32W.
Ready-to-Run (RTR) SSR DC Speaker Protection and Delay GB
Last edited:
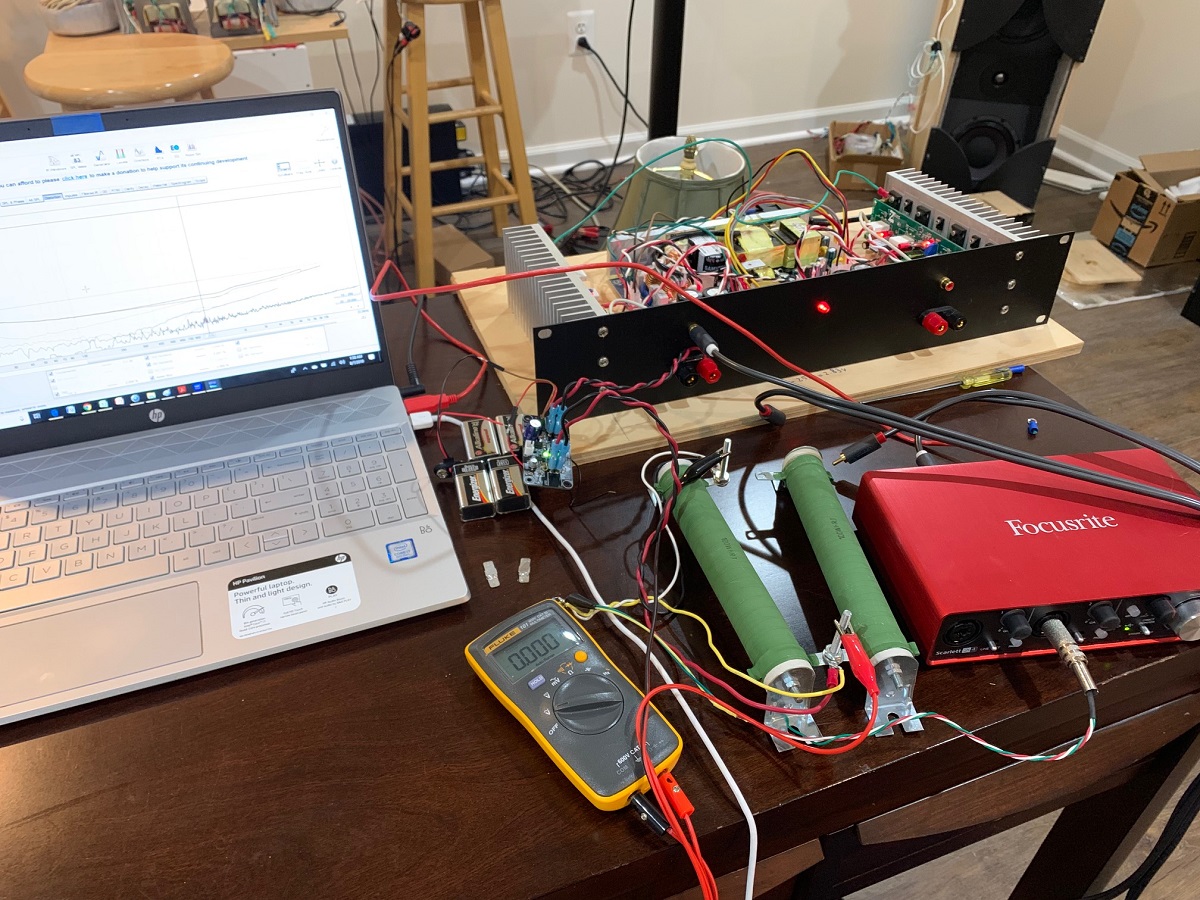
hep needed with setup
Hi, thanks for the guide XRK.
I think I must be doing something wrong here because my measurements seem way out.
The setup:
Behringer UCA202 connected to laptop with SSD on battery power.
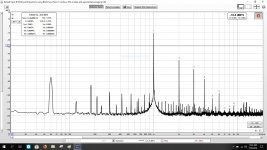
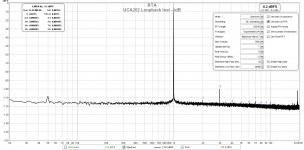
When I check the UCA202 self noise, it looks good.When I do a loopback test using the internal REW generator, again it looks ok:

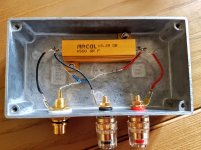
I use this setup for dummy load (8R, 50W power resistor) and attenuator (22K and 2.2K resistors).
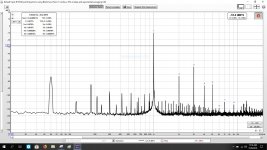
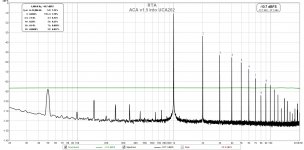
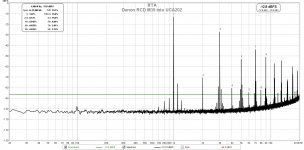
 However, when I connect to an amp, I seem to have problems in that the harmonics are way too high. I tried first with the ACA 1.5, then tried it on a Denon RCDM39 which is my kitchen music player.


Voltage across the resistor is 2.730V
Graph controls for the RTA are the same as those in the first post in this thread
Any ideas where I’m going wrong?
Cheers
Neal
Hi, thanks for the guide XRK.
I think I must be doing something wrong here because my measurements seem way out.
The setup:
Behringer UCA202 connected to laptop with SSD on battery power.
When I check the UCA202 self noise, it looks good.When I do a loopback test using the internal REW generator, again it looks ok:
I use this setup for dummy load (8R, 50W power resistor) and attenuator (22K and 2.2K resistors).
Voltage across the resistor is 2.730V
Graph controls for the RTA are the same as those in the first post in this thread
Any ideas where I’m going wrong?
Cheers
Neal
Attachments
- Home
- Design & Build
- Software Tools
- How to - Distortion Measurements with REW