I made these models partly to test out some changes I've made in how I go about creating models.
Note that the 3264/1295 are the same chip as the 3263/1294, just in a different package. The MT-200 versions are typically unobtanium.
.model 2SC3263-Y_kq npn ; Revision 4 by keantoken - Feb 27 2019
+ Bf=84 Vaf=150 Is=1.8p Cjc=600p Cje=15n Tf=2.2n
+ Rb=.22 Rbm=0 Irb=200m Re=38m
+ Rc=1m Rco=750m Vo=1000 Gamma=24n Qco=100p quasimod=1
+ Br=8 Ise=16p Ikf=1000 Nk=0.2
+ Itf=10 Xtf=100 Vtf=0.8 Xtb=1.4
+ Vceo=230 Icrating=15A mfg=Sanken
.model 2SA1294-Y_kq pnp ; Revision 3 by keantoken - Feb 27 2019
+ Bf=90 Vaf=150 Is=60f Cjc=1.2n Cje=20n Tf=3.9n
+ Rb=1.4 Rbm=0 Irb=3 Re=33m
+ Rc=8m Rco=380m Vo=1000 Gamma=160p Qco=100p quasimod=1
+ Br=8 Ise=0 Ikf=22 Nk=0.5
+ Itf=10 Xtf=100 Vtf=0.8 Xtb=1.7
+ Vceo=230 Icrating=15A mfg=Sanken
.model 2SC3264-Y_kq npn ; Revision 4 by keantoken - Feb 27 2019
+ Bf=84 Vaf=150 Is=1.8p Cjc=600p Cje=15n Tf=2.2n
+ Rb=.22 Rbm=0 Irb=200m Re=38m
+ Rc=1m Rco=750m Vo=1000 Gamma=24n Qco=100p quasimod=1
+ Br=8 Ise=16p Ikf=1000 Nk=0.2
+ Itf=10 Xtf=100 Vtf=0.8 Xtb=1.4
+ Vceo=230 Icrating=17A mfg=Sanken
.model 2SA1295-Y_kq pnp ; Revision 3 by keantoken - Feb 27 2019
+ Bf=90 Vaf=150 Is=60f Cjc=1.2n Cje=20n Tf=3.9n
+ Rb=1.4 Rbm=0 Irb=3 Re=33m
+ Rc=8m Rco=380m Vo=1000 Gamma=160p Qco=100p quasimod=1
+ Br=8 Ise=0 Ikf=22 Nk=0.5
+ Itf=10 Xtf=100 Vtf=0.8 Xtb=1.7
+ Vceo=230 Icrating=17A mfg=Sanken
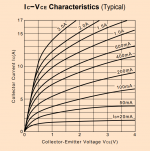
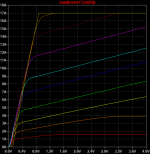
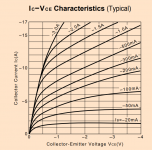
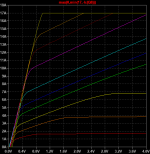
These models were fitted mainly to the Ic vs Vce chart, which includes quasi-saturation and gives better overall accuracy even though the fit to the Hfe vs Ic chart may not look excellent. The fact is a model that fits the Hfe chart perfectly is actually likely to be a poor model overall.
Apparent deficiencies of these models:
Hfe is too high in high-current deep saturation, as the Vo parameter seems to be doing the opposite of what it should. Hence Vo has been made too high to interfere.
Vaf (Early voltage) is not accurate. It is a best guess as there is no data.
It's been suggested that Rb/Re/Rc are incorrect even though I got the best fit to the data with the current combinations.
Qco determines the slowdown due to quasi-saturation, but I don't know the best way to determine this parameter. So I've set it to a low value, which will in theory be better than not at all.
I can improve the model if someone can take measurements:
Cbe and Cbc values, and perhaps at multiple bias levels.
Vaf measurements as the current values are are only educated guesses.
Note that the 3264/1295 are the same chip as the 3263/1294, just in a different package. The MT-200 versions are typically unobtanium.
.model 2SC3263-Y_kq npn ; Revision 4 by keantoken - Feb 27 2019
+ Bf=84 Vaf=150 Is=1.8p Cjc=600p Cje=15n Tf=2.2n
+ Rb=.22 Rbm=0 Irb=200m Re=38m
+ Rc=1m Rco=750m Vo=1000 Gamma=24n Qco=100p quasimod=1
+ Br=8 Ise=16p Ikf=1000 Nk=0.2
+ Itf=10 Xtf=100 Vtf=0.8 Xtb=1.4
+ Vceo=230 Icrating=15A mfg=Sanken
.model 2SA1294-Y_kq pnp ; Revision 3 by keantoken - Feb 27 2019
+ Bf=90 Vaf=150 Is=60f Cjc=1.2n Cje=20n Tf=3.9n
+ Rb=1.4 Rbm=0 Irb=3 Re=33m
+ Rc=8m Rco=380m Vo=1000 Gamma=160p Qco=100p quasimod=1
+ Br=8 Ise=0 Ikf=22 Nk=0.5
+ Itf=10 Xtf=100 Vtf=0.8 Xtb=1.7
+ Vceo=230 Icrating=15A mfg=Sanken
.model 2SC3264-Y_kq npn ; Revision 4 by keantoken - Feb 27 2019
+ Bf=84 Vaf=150 Is=1.8p Cjc=600p Cje=15n Tf=2.2n
+ Rb=.22 Rbm=0 Irb=200m Re=38m
+ Rc=1m Rco=750m Vo=1000 Gamma=24n Qco=100p quasimod=1
+ Br=8 Ise=16p Ikf=1000 Nk=0.2
+ Itf=10 Xtf=100 Vtf=0.8 Xtb=1.4
+ Vceo=230 Icrating=17A mfg=Sanken
.model 2SA1295-Y_kq pnp ; Revision 3 by keantoken - Feb 27 2019
+ Bf=90 Vaf=150 Is=60f Cjc=1.2n Cje=20n Tf=3.9n
+ Rb=1.4 Rbm=0 Irb=3 Re=33m
+ Rc=8m Rco=380m Vo=1000 Gamma=160p Qco=100p quasimod=1
+ Br=8 Ise=0 Ikf=22 Nk=0.5
+ Itf=10 Xtf=100 Vtf=0.8 Xtb=1.7
+ Vceo=230 Icrating=17A mfg=Sanken
These models were fitted mainly to the Ic vs Vce chart, which includes quasi-saturation and gives better overall accuracy even though the fit to the Hfe vs Ic chart may not look excellent. The fact is a model that fits the Hfe chart perfectly is actually likely to be a poor model overall.
Apparent deficiencies of these models:
Hfe is too high in high-current deep saturation, as the Vo parameter seems to be doing the opposite of what it should. Hence Vo has been made too high to interfere.
Vaf (Early voltage) is not accurate. It is a best guess as there is no data.
It's been suggested that Rb/Re/Rc are incorrect even though I got the best fit to the data with the current combinations.
Qco determines the slowdown due to quasi-saturation, but I don't know the best way to determine this parameter. So I've set it to a low value, which will in theory be better than not at all.
I can improve the model if someone can take measurements:
Cbe and Cbc values, and perhaps at multiple bias levels.
Vaf measurements as the current values are are only educated guesses.
Last edited:
I made these models partly to test out some changes I've made in how I go about creating models.
.model 2SC3264-Y_kq npn ; Revision 2 by keantoken - Feb 25 2019
+ Bf=83 Vaf=150 Is=900f Cjc=600p Cje=15n Tf=2.2n
+ Rb=.22 Rbm=0 Irb=200m Re=38m
+ Rc=1m Rco=750m Vo=1000 Gamma=12n Qco=100p
+ Br=8 Ise=8p Ikf=1000 Nk=0.2
+ Itf=10 Xtf=100 Vtf=0.8 Xtb=1.4
+ Vceo=230 Icrating=17A mfg=Sanken
.model 2SA1295-Y_kq pnp ; Revision 2 by keantoken - Feb 25 2019
+ Bf=90 Vaf=150 Is=60f Cjc=1.2n Cje=20n Tf=3.9n
+ Rb=1.4 Rbm=0 Irb=3 Re=33m
+ Rc=8m Rco=380m Vo=1000 Gamma=160p Qco=100p
+ Br=8 Ise=0 Ikf=22 Nk=0.5
+ Itf=10 Xtf=100 Vtf=0.8 Xtb=1.7
+ Vceo=230 Icrating=17A mfg=Sanken
These models were fitted mainly to the Ic vs Vce chart, which includes quasi-saturation and gives better overall accuracy even though the fit to the Hfe vs Ic chart may not look excellent. The fact is a model that fits the Hfe chart perfectly is actually likely to be a poor model overall.
Apparent deficiencies of these models:
Hfe is too high in high-current deep saturation, as the Vo parameter seems to be doing the opposite of what it should. Hence Vo has been made too high to interfere.
Vaf (Early voltage) is not accurate. It is a best guess as there is no data.
It's been suggested that Rb/Re/Rc are incorrect even though I got the best fit to the data with the current combinations.
Qco determines the slowdown due to quasi-saturation, but I don't know the best way to determine this parameter. So I've set it to a low value, which will in theory be better than not at all.
I can improve the model if someone can take measurements:
Cbe and Cbc values, and perhaps at multiple bias levels.
Vaf measurements as the current values are are only educated guesses.
I have test equipment but I do not have these parts. In addition, I could use some help modeling some output FETs that I am using. Maybe we could collaborate?
Send me a pm.
Here is a datasheet comparison.
The commercial curve tracer building blocks to produce these curves are around $30k if you want calibrated digital data results.
A DIY curve tracer could do it, of course, but that is a large task if you want digital data for every point of the curve. Multiple remote controlled beefy power supplies, shunts, multiple DMMs, a bunch of software to write.
For these particular curves, you have to be able to force up to 3A through the base while forcing small voltages at high current from collector trough emitter. The commercial building blocks are available for these voltages and currents to produce curves.
From the standpoint of the datasheet vs. the SPICE results, it looks like the SPICE simulations are the result of a pice-wise approximation instead of a smooth quadratic approximation.
My apologies if none of this is news to you.
The datasheet curves only go to 4V Vce. I think you need to see out to saturation voltage for the Ibe steps that you are interested in. From the datasheet, you do not know where the curves flatten out. Additionally, the transistor in your hand may be quite a bit different than the one in the datasheet.
The curve tracer building block I am thinking of will go to 40V at 50A pulsed and 10V at 20A DC. That should fill in the curves of interest. I would start with DC and switch to pulsed if needed. Pulsed mode at high current is prone to ringing from inductance of the test rig that would have to be cobbled together to connect to your device.
The curve tracer building block I am thinking of will go to 40V at 50A pulsed and 10V at 20A DC. That should fill in the curves of interest. I would start with DC and switch to pulsed if needed. Pulsed mode at high current is prone to ringing from inductance of the test rig that would have to be cobbled together to connect to your device.
I don't need Vaf at high currents, just at low currents from 1V to as high voltage as you can go. No need for overpowered test rigs. If there are special effects at high current high voltage, then there might not be parameters to model them anyways. Not really interested in stuff outside the SOA curve. If the measurements are not pulsed or isothermal, then I have to manually correct based on estimated thermal variables. So pulsed/isothermal is the norm except at low power where junction heating is negligible.
If you can do a high voltage pulsed/isothermal measurement, then we can improve our models for VAS transistors such as the KSC1381.
If you can do a high voltage pulsed/isothermal measurement, then we can improve our models for VAS transistors such as the KSC1381.
I don't need Vaf at high currents, just at low currents from 1V to as high voltage as you can go. No need for overpowered test rigs. If there are special effects at high current high voltage, then there might not be parameters to model them anyways. Not really interested in stuff outside the SOA curve. If the measurements are not pulsed or isothermal, then I have to manually correct based on estimated thermal variables. So pulsed/isothermal is the norm except at low power where junction heating is negligible.
If you can do a high voltage pulsed/isothermal measurement, then we can improve our models for VAS transistors such as the KSC1381.
The most important thing at this point is that I do not have any of the Sanken parts.
I do have a small stash of KSC1381E and KSC3503E. I can perform some curve traces on those and together we can zero in on exactly what you need. Once we have you satisfied with the transistors that I have, we can move on to other devices.
Dear keantoken,
as the 2SC3264/A1295 are becoming unobtanium but the 2SC6145/2SA2223 are still available could the models be tweaked to reflect the very similar (maybe same but smaller die) 2sc6145/2sa2223?
BR, Toni
P.S.: My DCA75pro curve testing feature is designed for small signal transistors only...
as the 2SC3264/A1295 are becoming unobtanium but the 2SC6145/2SA2223 are still available could the models be tweaked to reflect the very similar (maybe same but smaller die) 2sc6145/2sa2223?
BR, Toni
P.S.: My DCA75pro curve testing feature is designed for small signal transistors only...
DCA curves are still useful, please post them if you can.
The 1295/3264 are the same chip as the 1294/3263, just in a different package. Should I just change the name of the models if the MT-200s are unobtanium?
They are here:
Transistors from Sanken | Profusion Audio Design
I was considering doing the C6145/A2223 after these models which were sort of a test run.
Yes, the datasheets of 1295/3264 and 1294/3263 look like a copy...Maybe you can duplicate the model files or supply it with an AKO?
The datasheet of 6145/2223 look very similar to the above SANKENs
The 6145A/222A3 I have > 100 on stock are only Y grade (for 2StageEF you know ...)
I will post here the DCA75pro curve data if you like, or in another thread if you want. Just let me know.
BR, Toni
The datasheet of 6145/2223 look very similar to the above SANKENs
The 6145A/222A3 I have > 100 on stock are only Y grade (for 2StageEF you know ...)
I will post here the DCA75pro curve data if you like, or in another thread if you want. Just let me know.
BR, Toni
.model 2SC3263-Y_kq npn ; Revision 4 by keantoken - Feb 27 2019
+ Bf=84 Vaf=150 Is=1.8p Cjc=600p Cje=15n Tf=2.2n
+ Rb=.22 Rbm=0 Irb=200m Re=38m
+ Rc=1m Rco=750m Vo=1000 Gamma=24n Qco=100p quasimod=1
+ Br=8 Ise=16p Ikf=1000 Nk=0.2
+ Itf=10 Xtf=100 Vtf=0.8 Xtb=1.4
.model 2SA1294-Y_kq pnp ; Revision 3 by keantoken - Feb 27 2019
+ Bf=90 Vaf=150 Is=60f Cjc=1.2n Cje=20n Tf=3.9n
+ Rb=1.4 Rbm=0 Irb=3 Re=33m
+ Rc=8m Rco=380m Vo=1000 Gamma=160p Qco=100p quasimod=1
+ Br=8 Ise=0 Ikf=22 Nk=0.5
+ Itf=10 Xtf=100 Vtf=0.8 Xtb=1.7
Hi
Just first impressions.
RBM is physically unrealistic, as we discussed in email.
Can you increase it without too much mismatch to data?
Towards a max of 0.5*RB.
Similarly RC should be perhaps 2*RE.
If you increase it then what data would mismatch?
It seems to me that VO should be closely tied to properties of the semiconductor so I would not expect much variation from the default.
Since the default is 10, VO=1000 seems odd.
IKF=1000 for the sc3263 seems implausible, based on what data?
Best wishes
David
You need to get your hands dirty. I didn't want to make Nk too high in order to avoid convergence issues, and in any case the effect of Ikf seems absent in the datasheet, IE if Ikf is too low the data doesn't fit.
Note that the vast majority of the Hfe droop in the datasheet chart is due to quasi-saturation, so it's not as if beta droop is not being modeled. As for the higher voltage regions of operation no one knows, but if I were to lower Ikf I would have to increase Nk above 1, which in my experience leads to solver/convergence issues.
As for Vo, in some cases with high Vbe it has the opposite of the result intended, which I told you but you but you won't get your hands dirty. If you would just experiment with the model yourself you would see why I have Vo at a high value.
Look at page 15:
http://www.designers-guide.org/VBIC/documents/VbicText.pdf
Perhaps these things could be improved, but I need to reduce my modeling activities as it has taken up too much of my time recently.
and in any case the effect of Ikf seems absent in the datasheet, IE if Ikf is too low the data doesn't fit.
Yes, my point was that if the effect is absent in the datasheet then I would simply leave IKF out of the model.
As for Vo, in some cases...it has the opposite of the result intended, which I told you...If you would just experiment with the model yourself...
I read, and paid attention to, your comment about VO, the problem was I didn't understand how this could be.
My comment was only that the VO value seemed odd, it was not a criticism of your work.
The reference looks excellent and probably explains it, exactly what I needed, thank you.
Where would an increase in RC contradict the data sheet or show up?
Best wishes
David
Last edited:
RBM is physically unrealistic
It's important to note that Irb is the current at which Rb falls halfway to it's minimum value Rbm. So Rb doesn't actually fall to zero. So I don't think Rbm=0 is a big issue.
I do appreciate your feedback, regardless of how well I temper my replies.
I read, and paid attention to, your comment about VO, the problem was I didn't understand how this could be.
My comment was only that the VO value seemed odd, it was not a criticism of your work.
You can't make a good model or understand the process with a hands-off approach. The fact that the model doesn't have perfect physical correspondence means that you literally don't know what you're doing much of the time, especially when you get within say 10%. That remaining 10% has to do with judgement, which is laced with intuition unless you have the luxury of a complete dataset and only care about % error.
Here is a VBIC model which fits deep quasi-saturation MUCH better, VBIC fixed the Vo issue.
.model 2SC3264-Y_ex npn ( level=9 ; EXPERIMENTAL model by keantoken Feb 26
+ rcx=1.0e-03 rci=7.5e-01 gamm=33n vo=10 HRCF=60m qco=1.0e-10 rbx=0
+ rbi=2.2e-01 re=32m is=1.8e-12 nf=1 nr=1 fc=5.0e-01
+ cje=1.5e-08 pe=7.5e-01 me=3.3e-01 cjc=6.0e-10 cjep=0 pc=7.5e-01
+ mc=3.3e-01 cjcp=0 ps=7.5e-01 ms=0 ibei=2.142857e-14 nei=1
+ iben=1.6e-11 nen=1.5 ibci=2.25e-13 nci=1 ibcn=0 ncn=2
+ vef=1.016397e+02 ver=6.476082e+09 ikf=1000 nkf=2.0e-01 ikr=0 tf=2.2e-09
+ xtf=100 vtf=8.0e-01 itf=10 tr=0 td=0 ea=1.11
+ eaie=1.11 eaic=1.11 eane=1.11 eanc=1.11 xis=3 xii=1.6
+ xin=1.6 kfn=0 afn=1
+ )
Note that there is no Irb parameter in the VBIC model.
It's important to note that Irb is the current at which Rb falls halfway to it's minimum value Rbm. So Rb doesn't actually fall to zero.
Yes, it had occurred to me that it approaches zero asymptotically, so we never have a divide by zero disaster.
Otherwise I would have been much more critical
")
I do appreciate your feedback...temper my replies.
Pleased to help, and no problem with the replies.
Best wishes
David
Has anybody tested the models from the original post? I did buy a few from ProFusion before they went EOL, I also have some knock-offs/fakes from ICSemi. If keantoken is still interested in improving the models (although the transistors are unobtainium), I would be willing to take some measurements.
- Home
- Design & Build
- Software Tools
- LTspice models for Sanken 2SC3264/A1295