This applies to All simulators, not just WinISD.
I'm sure most people are aware about Power Compression when driving speakers, & how it limits output levels, & changes the f3 point & xmax is reached sooner etc.
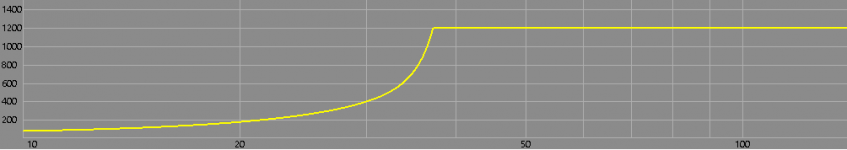
What's also helpful in analysing the limitations, is to be able to see an indication of how the power rating is decreased, & where.
In my two screenies you will see the same driver/box/fb etc with a graph taken at both 20c & 270c, with the ambient temp at 20c. Obviously in higher warm/hot conditions, the power ratings & spl etc will be worse.
I tried to take the same screenies with Horn Response for comparison, but wasn't able to find the appropiate tab etc in which to do so ? I could have shown the spl dB differences, but i wanted to show the power reduction points in Watts, as i have with WinISD.
I'm sure most people are aware about Power Compression when driving speakers, & how it limits output levels, & changes the f3 point & xmax is reached sooner etc.
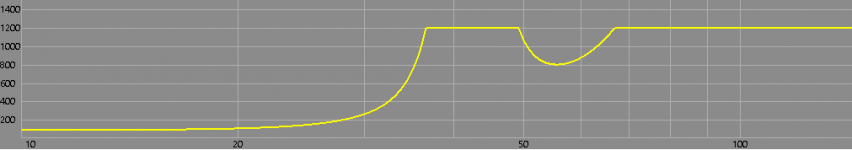
What's also helpful in analysing the limitations, is to be able to see an indication of how the power rating is decreased, & where.
In my two screenies you will see the same driver/box/fb etc with a graph taken at both 20c & 270c, with the ambient temp at 20c. Obviously in higher warm/hot conditions, the power ratings & spl etc will be worse.
I tried to take the same screenies with Horn Response for comparison, but wasn't able to find the appropiate tab etc in which to do so ? I could have shown the spl dB differences, but i wanted to show the power reduction points in Watts, as i have with WinISD.
Attachments
- Status
- This old topic is closed. If you want to reopen this topic, contact a moderator using the "Report Post" button.