You should be able to run a simple cal cycle using the above with the mic input simply knowing the sensitivity of the mic. This is something that could be added but most useful information is based on relative data, there are not many cases where absolute SPL plus minus several dB really matters.
Thanks Scott. A useful bit pf additional information and code. And to follow up an this anyone making this type of a setup would be wise to have a microphone calibration reference if they need absolute SPL numbers. I have a few microphone calibrators and basic ones are not that expensive anymore.
You can't work with a basic microphone sensitivity in millivolt/Pascal?
Hi Mark
The word "can't" should be "didn't". Of course its possible, I just didn't see the need for all that extra work. If I needed to know the sensitivity of a loudspeaker (which I seldom did) I would just use a SLM and a known signal. Calibration within the measurement system is nice, but hardly essential.
Earl you are correct. But in my little business I get people that like to have the bells and whistles that Klippel has been successfully selling people.
As much as I like what Klippel has done for test and measurement standards I keep thinking about them as I think about Bose products. Great engineering, solid marketing and high price.
Many other test and measurement systems are as good but do not have the marketing cache. And that I don't like.
Earl I'd like to say thank you to you for letting out your measurement code into the public domain. We will definitely use it. More than a few of my colleagues and acquaintances have been given a heads up about this thread. If the code and interface become a solid setup I will in very short order make up the hardware to test it out.
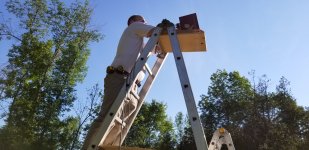
Yes I'm steadying myself with my Ab
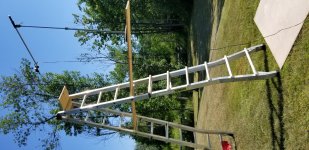
Mic at 0.5 meters. 4 meters in the air on a heavy duty step ladder and at least 10 meters from anything else.
there are a few things in here
firstly there is the question of how to handle the output from the FFT function. I think, when calculating the magnitude from the output, one needs to normalise the amplitude like abs(fftx) * 2 / sum(win) in order to account for the effect of the window and discarding half the output. Is this correct?
secondly there are a set of features around taking measurements from within this app. IMV this should be a long way down the list of priorities as there are plenty of apps that can do this job perfectly well already. The reason to bump this up the list would be if there is some particular set of features that doesn't exist in those other apps. Is that the case? Is there some other reason to add measurement capability to this app?
finally there is the q of how to present that data on a chart, is it dBFS or dB SPL? in either case it's just a Q of what is the reference value. In the absence of measurement capability, dB SPL can be done by asking the user to enter the reference value manually. Whether this is easy for the user to work out is another Q of course but it's certainly trivial from the point of view of this app (assuming measurements are actually taken in another app).
secondly there are a set of features around taking measurements from within this app. IMV this should be a long way down the list of priorities as there are plenty of apps that can do this job perfectly well already.
I was simply showing what I thought would be the most painless way for those interested. If there is no format issue between the other apps (i.e. for instance they all have .wav output option) there would be no need for it.
there are a few things in here
firstly there is the question of how to handle the output from the FFT function. I think, when calculating the magnitude from the output, one needs to normalise the amplitude like abs(fftx) * 2 / sum(win) in order to account for the effect of the window and discarding half the output. Is this correct?
secondly there are a set of features around taking measurements from within this app. IMV this should be a long way down the list of priorities as there are plenty of apps that can do this job perfectly well already. The reason to bump this up the list would be if there is some particular set of features that doesn't exist in those other apps. Is that the case? Is there some other reason to add measurement capability to this app?
finally there is the q of how to present that data on a chart, is it dBFS or dB SPL? in either case it's just a Q of what is the reference value. In the absence of measurement capability, dB SPL can be done by asking the user to enter the reference value manually. Whether this is easy for the user to work out is another Q of course but it's certainly trivial from the point of view of this app (assuming measurements are actually taken in another app).
Since we are not going to worry about scaling for the first round, and we won't be using a window, nothing needs to be done to the FFT output.
I have been doing this for years with measurement data from another app, why change that now. There is no reason to add the measurement capability at this point since so many other apps have this capability. I would like to see us be able to use most of them for input, certainly Holm Impulse since it has served me very well. The data should be in a form that can be viewed with Notepad, i.e. text. Being able to look at the raw data has served me well on many occasions.
I would just set the scale like I said, an average around 1 kHz is set to 0 dB. Then if the user wants they can set the scale to absolute number with a simple external measurement.
Why do anything at this stage that does not have to be done? KISS
sorry, I didn't mean to imply that your post was not useful, just that I don't intend to spend any time on that unless someone has a good reason as to why other apps can't be used instead.I was simply showing what I thought would be the most painless way for those interested. If there is no format issue between the other apps (i.e. for instance they all have .wav output option) there would be no need for it.
some pics
you can load a bunch of impulses
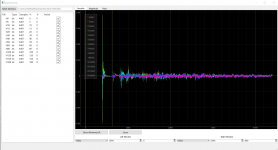
apply gate & windows
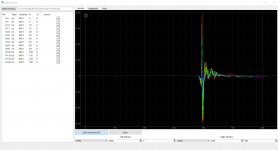
then show the FR (that comes out of Earl's fft & linToLog)
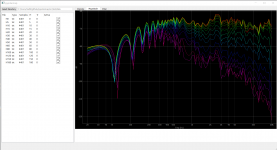
there is also the beginning of a sonagram view on that but suffice to that pyqtgraph has some rather obscure to non existent documentation so figuring out exactly how to get it to work properly has proven to be a slightly irritating task
you can load a bunch of impulses

apply gate & windows

then show the FR (that comes out of Earl's fft & linToLog)

there is also the beginning of a sonagram view on that but suffice to that pyqtgraph has some rather obscure to non existent documentation so figuring out exactly how to get it to work properly has proven to be a slightly irritating task
sorry, I didn't mean to imply that your post was not usefu
No problem at all, just fiddled up something that someone might find useful. There is another thread here on using Python to run a suite of turntable setup tracks from a test LP and I was looking for a painless way to have the app do everything.
The frequency response doesn't look right to me.
Why is there so much blank signal before the impulse? Shouldn't it start just before the impulse? And run out to the data length?
Try dropping the linear points down to 50 is you are only going to use a small number of data points. For 100 you should have 512 data points or more and 200 should have 1024 or more.
no particular reason, the left gate is user selectable and I just dragged it to some random location before the peak in order to take a pic of a graphWhy is there so much blank signal before the impulse? Shouldn't it start just before the impulse? And run out to the data length?
ok sure, I've added this mapping (read it as a list of no of linear pts: logPts)Try dropping the linear points down to 50 is you are only going to use a small number of data points. For 100 you should have 512 data points or more and 200 should have 1024 or more.
Code:
logPts = {
    64: 15,
    128: 30,
    256: 50,
    512: 100,
    1024: 200,
    2048: 300,
    4096: 300
}
and pulled the window in which gives
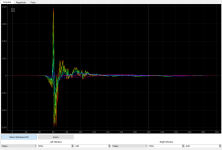
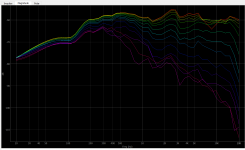
do you have any views on the fft normalisation question?
It's a little bothersome to me that the Frequency response depends on the window - it shouldn't, unless the window itself is the cause of the changes. As I said before, I would not use a window taper at all (use rect(x)) unless you are sure that it is not creating a problem. I would start the window as close to the leading edge as possible.
I have never seen a case where more than 200 pts are required. That's plenty of points for a averaged log spaced data.
As to fft normalization, I gave my view - twice now I believe. I would just not do anything and normalize everything at the conclusion of the analytics - use 1/3 octave average about 1 kHz as the 0 dB reference. An SPL meter of a 1/3 octave noise signal will then give the absolute level of 0 dB.
sorry I wasn't clear. I understand that you recommend the aforementioned approach, my Q is specifically about normalising the output from FFT though as opposed to an overall calibration strategy )and is partly for my own education). If I do want to normalise the output from your FFT function, is that (i.e. abs(x) * 2 / sum(win)) the correct way to do so?As to fft normalization, I gave my view - twice now I believe. I would just not do anything and normalize everything at the conclusion of the analytics - use 1/3 octave average about 1 kHz as the 0 dB reference. An SPL meter of a 1/3 octave noise signal will then give the absolute level of 0 dB.
I don't understand the concern, that changing the window for this sort of signal changes the reported FR seems completely normal to me. Anyway I can add a rectangular window to the list of options and then leave the user to decide what they want to do.It's a little bothersome to me that the Frequency response depends on the window - it shouldn't, unless the window itself is the cause of the changes.
I thought we should recap where we are and make sure we know what to do next
I don't think we've done these yet
I guess this is covered by the following functions in the DLL but I don't know how to use them.
CalSpatial
CalPower
CalVelocity
CalPolar
Therefore I think the key next step is one or more of the remaining DLL functions. If so, @gedlee can you provide some guidance on how to handle this? which function to call, what data is required and so on.
we have a basic UI, it's in the public domain and is able to talk to python<->fortran successfully. We also know how to create minimal test cases in c# for the cases where we have to debug fortran.1)Someone needs to write the GUI. I can supply all the calculations as DLL's. I only know VB.NET for GUIs, but I could read C#. Any other languages are probably not workable. The GUI would have to be public domain and the DLL's will be supplied to do the full 3D calculations.
this bit is doneThe GUI needs to read the measurement data files, display them, window them, FFT them and array the measurements in the proper matrices to be passed to the DLL.
this is doneThe DLL also contains the FFTs (for speed) and the log to linear interpolation in frequency that I do, which also does the ERB smoothing.
Then the DLL calculates the modal coefficients which are passed back to the GUI. These coefficients completely specify the polar response and can be thus stored as they are to be read back in for later viewing.
There is another call to the same DLL to create the pressure responses from the coefficients, as well as the power response and the DI.
I don't think we've done these yet
I guess this is covered by the following functions in the DLL but I don't know how to use them.
CalSpatial
CalPower
CalVelocity
CalPolar
I am working on a contour plot atm and I know how to do the interactive side of it so this isn't done but seems like a known quantity.As to the GUI, I suggest the same basic format that my current GUI uses.
- lower plot is a contour map of angle versus frequency from 0 - 90, or -90 - 90, or -180 - 180, over Phi angle chosen by a dial on the right hand of the plot. A cursor on the polar map will show the frequency response on a top plot that has the power response and DI plotted as well for the chosen Phi and Theta on the lower plots.
I've played with lots of ways to show the data and this, to me, seems to be the best.
Therefore I think the key next step is one or more of the remaining DLL functions. If so, @gedlee can you provide some guidance on how to handle this? which function to call, what data is required and so on.
sorry I wasn't clear. I understand that you recommend the aforementioned approach, my Q is specifically about normalising the output from FFT though as opposed to an overall calibration strategy )and is partly for my own education). If I do want to normalise the output from your FFT function, is that (i.e. abs(x) * 2 / sum(win)) the correct way to do so?
I don't understand the concern, that changing the window for this sort of signal changes the reported FR seems completely normal to me. Anyway I can add a rectangular window to the list of options and then leave the user to decide what they want to do.
Since I didn't use a window of any significance the issue of how to handle the scaling when a window is used never came up. IMO no window should be used except for a taper of the data at the very end of the window, but this is so minimal as to not require any adjustment in the code.
I would strongly suggest not using a window that acts on the main impulse at all. This is not what windows are for. If the data set goes to zero at the end points, which of course in our case it must do on the left, and should be very close to zero on the right, then no window is required. Windows are for data that does not have a clear starting and stopping and so the data must be forced to zero. Allowing for a window that is inappropriate will only lead to trouble as if something can get screwed up it most certainly will at some point. I am against using any window at all at this time.
I may understand the issue with the change in frequency response with the window location. In theory there should not be any change as the window is slide along the time axis, as long as new reflection do not enter the data as this is done. BUT, since the FFT data is complex we have to consider the effect of phase on the interpolation from LintoLog. If the left edge of the window is very far out from the impulse then there will be a huge phase wrap. And even though there is no effect of this on the magnitude of the coefficients the phase wrap will cause the complex coefficients to change at an exceedingly fast rate. This will make it very hard for the complex interpolation to keep up. By shortening the left window to the lowest possible, this will minimize the phase warp and yield the best results.
I have always done this instinctively, but we should be clear to users that not doing this can result in faulty data.
The next step would be to call CalSpatial which looks like
Code:
SUBROUTINE CalSpatial(  DataIn,            &    ! The raw data from Holm
                        AnglesIn,          &    ! the angles the data is taken (radians)
                        NumAngleIn,        &    ! The number of angles for the data
                        Freqs,             &    ! array of frequencies
                        NumLogPts,         &    ! The number of frequency points
                        DataOut,           &    ! Modal parameters by frequency
                        NumCoefs,          &    ! Number of fit coefficients
                        MeasureR,          &    ! distance of measurements
                        TransFreq,         &    ! blend frequency
                        LFGain,            &    ! blend adjust
                        BoxRadius,         &    ! blend adjust
                        Radius,            &    ! The driver radius
                        F0,                &    ! The source resonance
                        Q0,                &    ! the source Q
                        SourceType             )    ! flag for dipole system
use deffs

IMPLICIT NONE
! Specify that CalSpatial is exported to a DLL
!DEC$ ATTRIBUTES DLLEXPORT :: CalSpatial
! and that the external name is 'CalSpatial'
!DEC$ ATTRIBUTES ALIAS:'CalSpatial' :: CalSpatial
!DEC$ ATTRIBUTES REFERENCE :: DataIn, AnglesIn, Dataout, freqs
!DEC$ ATTRIBUTES value :: LFGain, BoxRadius, Radius, F0, Q0, NumLogPts, NumAngleIn, NumCoefs, MeasureR, TransFreq, SourceType

integer, intent(in):: NumAngleIn, NumLogPts, NumCoefs

COMPLEX(8), intent(out):: DataOut( 0:NumCoefs-1, 0:NumLogPts-1 )
COMPLEX(8), intent(in):: DataIn( 0:NumAngleIn-1, 0:NumLogPts-1)
REAL(8), intent(in):: AnglesIn( 0:NumAngleIn-1)  ! must be in radians
REAL(8), intent(in):: Freqs(0:NumLogPts-1)
Real(8), intent(in) :: MeasureR, TransFreq, LFGain, BoxRadius, Radius, F0, Q0
integer, intent(in) :: SourceType
MeasureR is the radius to the measurement sphere
TransFreq is about 200 (Hz, but is ignored for now)
LFgain is 0.0 (dB, and is ignored for now)
BoxRadius is the radius of a sphere the same volume as the enclosure (m, not used for now, but this should be a valid number like .25)
Radius is the radius of the LF driver (m, must be < BoxRadius)
F0 is the LF drivers resonance frequency (Hz, set to 70 for now)
Q0 is the LF drivers "Q" ( set to .7 for now)
SourceType must be 0 (for now)
NumCoefs is the number of modes to fit. Keep this < 15 (for now)
The rest should be self evident.
The LF driver data is used to simulate the LFs, which never worked very well, but then I didn't care too much since < 200 Hz is going to be room dominated anyways. A reasonable LF falloff was all that I really needed to see. Better LF models for Monopoles, Ported, Dipoles, is certainly possible, but not necessary at this point.
Getting good data out of CalSpatial will be a major milestone. The DataOut should be plotted to see if it looks reasonable.
Last edited:
We do know that on the right edge the signal remaining is only the ringing of the woofer and will not in general be zero (although it could be.) We do know that there cannot be any DC within the gate so a quick test is to see if the sum of the time values equals zero. If it does then everything is likely fine. If not then I have always thought that moving the gate a sample at a time to find the lowest DC value would be the best possible technique. Having tried this it just doesn't make all that much difference, and no difference above the gate limit frequency.
right ok, I had not considered that (left window position) effect on phase. Thanks for the explanation. I interpret this as meaning the following defaults should be applied
1) use a rectangular window by default
2) set the left window to the first "non zero" sample by default (where non zero is to be defined but could something like >1e-5 or perhaps ~15 samples behind the peak could be a more reliable default), point being to guide the user to the right choice
It would be nice to try to set the right gate by default as well but I'm less confident that is going to be worthwhile/reliable (i.e. easy thing for the eye/human brain to spot, harder to write code for).
agree?
I'm going to play these back one by one, pls let me know if anything I write is incorrect, unclear or open to interpretation. Note that Freqs is the one param I do not know how to set.
DataIn
- a 2d array
- 1st dimension corresponds to values given in AnglesIn
- 2nd dimension is the impulse response data *after gate/window has been applied*
AnglesIn
- angles converted to radians
NumAngleIn
- == AnglesIn.length
Freqs
- I don't know which freqs these are as DataIn appears to be the gated impulse response but the next arg is "NumLogPts" so that implies it is the log spaced freqs we get from linToLog
- but if that is the linToLog freqs then is DataIn really the IR?
NumLogPts
- unclear, see Freqs
DataOut
- an empty 2d array of the given size
- must be writeable by the dll
NumCoefs
- hardcode to 15 or should it vary (for example by the value given for NumLogPts)?
MeasureR
- what unit is this in? metres?
- what precision should be used? it is defined as a double precision value but I guess this is really going to be cm precision at most?
TransFreq, LFGain, BoxRadius, F0, Q0
- you intend for me to hardcode the specified value into the call to the dll, correct?
Having said that, my preference would be comparing against the direct output from the call via python to the same output from a call in your setup. This means you would need to feed a known dataset (e.g. the one you publish as an example on your website) along with some particular set of parameters into your code and dump to output to a file. I can then repeat the same with the call to the same dll via python and verify the output is the same.
I am of course happy to use other approaches that get us to the same place though.
DataIn
- a 2d array
- 1st dimension corresponds to values given in AnglesIn
- 2nd dimension is the impulse response data *after gate/window has been applied*
AnglesIn
- angles converted to radians
NumAngleIn
- == AnglesIn.length
Freqs
- I don't know which freqs these are as DataIn appears to be the gated impulse response but the next arg is "NumLogPts" so that implies it is the log spaced freqs we get from linToLog
- but if that is the linToLog freqs then is DataIn really the IR?
NumLogPts
- unclear, see Freqs
DataOut
- an empty 2d array of the given size
- must be writeable by the dll
NumCoefs
- hardcode to 15 or should it vary (for example by the value given for NumLogPts)?
MeasureR
- what unit is this in? metres?
- what precision should be used? it is defined as a double precision value but I guess this is really going to be cm precision at most?
TransFreq, LFGain, BoxRadius, F0, Q0
- you intend for me to hardcode the specified value into the call to the dll, correct?
I don't know what I'm plotting here, it's a 2d array on the output so I guess this should be plotted as another surface plot but I don't know what it should look like. Do you have an example?Getting good data out of CalSpatial will be a major milestone. The DataOut should be plotted to see if it looks reasonable.
Having said that, my preference would be comparing against the direct output from the call via python to the same output from a call in your setup. This means you would need to feed a known dataset (e.g. the one you publish as an example on your website) along with some particular set of parameters into your code and dump to output to a file. I can then repeat the same with the call to the same dll via python and verify the output is the same.
I am of course happy to use other approaches that get us to the same place though.
started cutting the graphs over to matplotlib as creating a contour plot in pyqtgraph seems utterly baffling (seems to involve applying transforms to the chart to say the documentation for this is sparse would be putting it generously)
I also added some gate position guesswork using scipy.signal.find_peaks_cwt — SciPy v1.1.0 Reference Guide to guess at the first reflection position (and a manual iteration back from the peak to find the left gate position). This seems to work ok on the few measurements I've tried, not sure how robust it will be mind you.
I also added some gate position guesswork using scipy.signal.find_peaks_cwt — SciPy v1.1.0 Reference Guide to guess at the first reflection position (and a manual iteration back from the peak to find the left gate position). This seems to work ok on the few measurements I've tried, not sure how robust it will be mind you.
- Home
- Design & Build
- Software Tools
- Klippel Near Field Scanner on a Shoestring