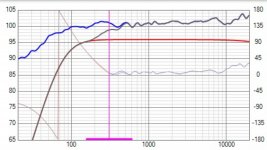
I’m following the simulated measurements guide off Undefinition, usually it works off response modeler but I’m waiting on a copy of excel so I found VituixCAD. So I’ve used vituix to trace my factory graph. I used vituix and WinISD to model my drivers in a box (near identical results btw). I now need to use merge to combine the two to get my simulated frd. So far these are my results. The first chart is the modeled drivers with the factory chart. The second is the modeled drivers with the factory chart for 2 drivers. Are either of these correct?
Attachments
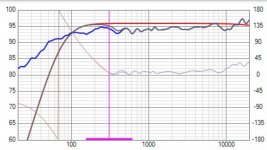
Both factory graph and box+driver simulation look like half space responses. If so, merging of these curves (and nothing else) is okay if you are making flush mounted speakers. But if your speakers will be typical box speakers, you need to make baffle simulation with Diffraction tool and export response. After that you can multiply merged half space response by exported diffraction response and scale the result response by -6 dB with Calculator tool. VituixCAD supports few other methods too.
Sorry that my answer is quite truncated but I have fever.
Sorry that my answer is quite truncated but I have fever.
Select that one which has correct SPL in your application: if you have two drivers in parallel, select traced curve having higher SPL. Then you should adjust level offset of simulated curve to match SPL with traced curve. Reality and simulation have some differences here.
I would also increase transition frequency to e.g. 500 Hz to get more realistic phase response. Now there is too sharp corner in phase because simulated system is ported and traced is big closed or IB.
I would also increase transition frequency to e.g. 500 Hz to get more realistic phase response. Now there is too sharp corner in phase because simulated system is ported and traced is big closed or IB.
One more thing. I'm not sure where and how you are using those responses. If you load them into crossover simulator where you connect two separate drivers in parallel or series, you should use frequency and impedance responses of single driver (with lower SPL and higher impedance) because crossover simulator calculates terminal voltages and sums acoustical signals.
From my point of view it is more common that all responses are measured or simulated from a single driver (if technically possible), and crossover simulator takes care of the rest. That also enables adjusting of directivity and power response with driver locations in case measurement set includes off-axis responses (0-90/180 deg). I suppose "guide of Undefinition" is some coarse pre-engineering style - not so advanced what VituixCAD is designed for.
From my point of view it is more common that all responses are measured or simulated from a single driver (if technically possible), and crossover simulator takes care of the rest. That also enables adjusting of directivity and power response with driver locations in case measurement set includes off-axis responses (0-90/180 deg). I suppose "guide of Undefinition" is some coarse pre-engineering style - not so advanced what VituixCAD is designed for.
- Status
- This old topic is closed. If you want to reopen this topic, contact a moderator using the "Report Post" button.