Just tiny addition today
Rev. 2.0.51.1 (2020-06-04)
Main program
* Added 'Save as overlay' command to context menu of Directivity Polar chart. Frequency and DI of overlays are visible in Traces window and Image copy/export. Not (yet) in tooltip.
Rev. 2.0.51.1 (2020-06-04)
Main program
* Added 'Save as overlay' command to context menu of Directivity Polar chart. Frequency and DI of overlays are visible in Traces window and Image copy/export. Not (yet) in tooltip.
Significant difference is actually obvious because LR12 low pass @24 kHz has phase shift of -28 deg at 6 kHz.
All this while I was looking at the SPL and thought since there was no change in SPL at 2 octaves below LP so there must be no change in phase as well. LR12 changes phase much before SPL, or atleast its not evident from the SPL curves. I learnt something new today, thanks Kimmosto for explaining.
Perhaps for you to consider for further standardization with CTA-2034A, the ability to toggle on and off the different scaling for the DI curves?
Let's try the same span without toggling. Looks quite okay, though it's not so revealing anymore.
Rev. 2.0.51.2 (2020-06-05)
Main program
* Added 'Main directory' selection to Options window. Enables other than \Users\username\Documents\VituixCAD.
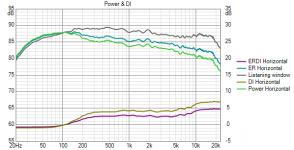
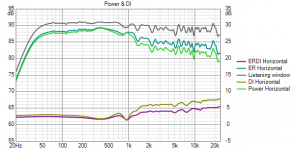
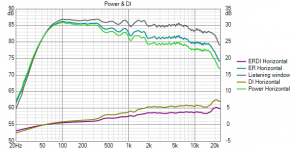
* DI axis span in Power & DI graph equals to dB SPL span.
I feel this is the most useful individual curve for describing soundstage performance.
'Soundstage performance' is quite abstract term. It's common that horizontal ER is good...very good (best group in total ER) because it's quite difficult to screw up with modern tools and common knowledge IMO. But there are still some clear differences in soundstage - or whatever we call how sound images locate in front of or around us and how natural they sound. RMS calculation is okay for sound balance evaluation, but coarse for more complex things.
And perhaps also the Total Horizontal (Front, Side Rear) and Total Vertical (ceiling, floor).
This is done. Now it's easy to see that value of ER horizontal and ERDI horizontal are close to zero in practice due similar content with listening window average. But hopefully the other curves show some interesting news.
Rev. 2.0.51.3 (2020-06-06)
Main program
* Added optional ER horizontal, ERDI horizontal, ER vertical and ERDI vertical curves to Power & DI chart and CTA-2034-A data export.
* Show Early reflection switches in context menu of Power & DI chart renamed and reordered:
- ER Horizontal = ER Front, ER Side, ER Rear, ER Horizontal and ERDI Horizontal
- ER Vertical = ER Floor, ER Ceiling, ER Vertical and ERDI Vertical
- ER Total = ER and ERDI per CTA-2034-A
Let's try the same span without toggling. Looks quite okay, though it's not so revealing anymore.
Rev. 2.0.51.2 (2020-06-05)
Main program
* Added 'Main directory' selection to Options window. Enables other than \Users\username\Documents\VituixCAD.
* DI axis span in Power & DI graph equals to dB SPL span.
Thanks for this!
'Soundstage performance' is quite abstract term. It's common that horizontal ER is good...very good (best group in total ER) because it's quite difficult to screw up with modern tools and common knowledge IMO. But there are still some clear differences in soundstage - or whatever we call how sound images locate in front of or around us and how natural they sound. RMS calculation is okay for sound balance evaluation, but coarse for more complex things.
This is done. Now it's easy to see that value of ER horizontal and ERDI horizontal are close to zero in practice due similar content with listening window average. But hopefully the other curves show some interesting news.
Rev. 2.0.51.3 (2020-06-06)
Yes, of course you're right about most modern speakers being very good in this regard and I personally prefer looking at the individual angles, or at least the front side and rear breakdown. But I was thinking more directivity width or narrowness. For this, I believe it is Horizontal ERDI more useful than the standard ER is.
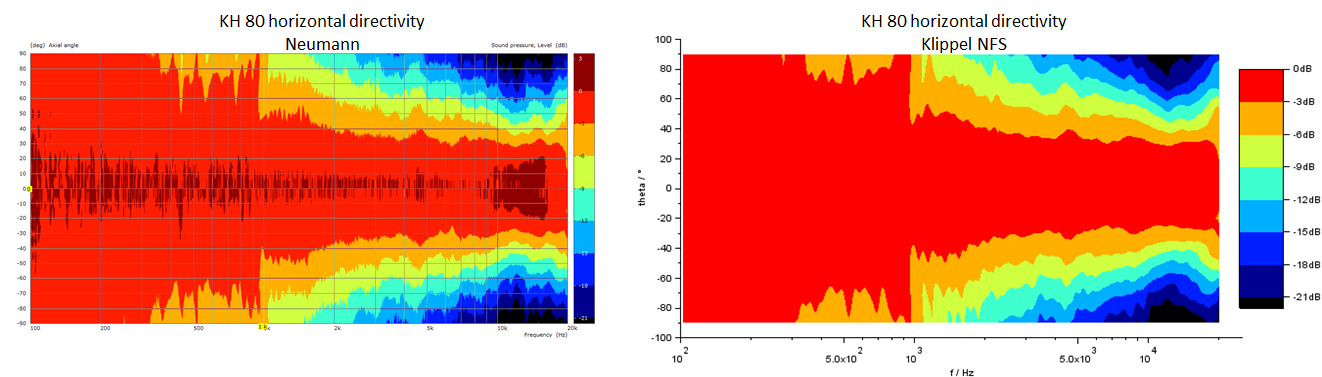
For example, when I measured the Dutch&Dutch 8C, the standard ER hides the constant/cardioid directivity because it is of course not constant directivity in the vertical domain, whereas the horizontal DI makes it obvious.

Of course normalized polar maps show this more clearly, but I tend to prefer working with SPL plots. Makes it a bit easier to compare several speakers at once.
Main program
* Added optional ER horizontal, ERDI horizontal, ER vertical and ERDI vertical curves to Power & DI chart and CTA-2034-A data export.
* Show Early reflection switches in context menu of Power & DI chart renamed and reordered:
- ER Horizontal = ER Front, ER Side, ER Rear, ER Horizontal and ERDI Horizontal
- ER Vertical = ER Floor, ER Ceiling, ER Vertical and ERDI Vertical
- ER Total = ER and ERDI per CTA-2034-A
Thank you, you keep on making my life much easier.
Of course normalized polar maps show this more clearly, but I tend to prefer working with SPL plots. Makes it a bit easier to compare several speakers at once.
Ok, I understand this need when comparing and reviewing several already designed products, but very original traces (years ago without a single ER curve) provide adequate information about directivity and power spectrum for designing product with balanced sound.
P.S. Narrow resistance enclosure with constant horizontal directivity was quite popular on local market few decades ago, but not so much anymore. Maybe designers have noticed that "too constant", leaking and not so dynamic is not so good decision for sound and commercially after hype is faded
")
the standard ER hides the constant/cardioid directivity because it is of course not constant directivity in the vertical domain, whereas the horizontal DI makes it obvious.
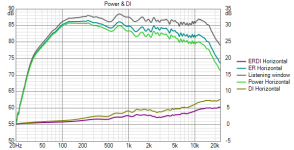
Once more about ER+ERDI per plane. Have you noticed that power & DI has "always" been possible to calculate also separately in horizontal and vertical planes? In addition, intensity for power & DI calculation has "always" been possible to calculate as weighted R.M.S. or unweighted average from radial measurements. Weighted R.M.S. i.e. 'Intensity on spherical surface' option has been default as a standard and suitable for common speakers.
The latest built of rev. 2.0.51.3 (2020-06-08) calculates intensity as R.M.S. instead of normal average when 'Intensity on cylinder surface' is selected in Options.
Selecting 'Intensity on cylinder surface' and checking either 'Include horizontal' or 'Include vertical' is correct method to evaluate overall power & DI (~sound balance) in single plane. Not previously added horizontal and vertical totals of ER+ERDI.
Therefore it's possible that ER+ERDI totals per plane will be replaced with power+DI per plane.
Last edited:
Ok, I understand this need when comparing and reviewing several already designed products, but very original traces (years ago without a single ER curve) provide adequate information about directivity and power spectrum for designing product with balanced sound.
P.S. Narrow resistance enclosure with constant horizontal directivity was quite popular on local market few decades ago, but not so much anymore. Maybe designers have noticed that "too constant", leaking and not so dynamic is not so good decision for sound and commercially after hype is faded
Oh yes, absolutely agree with you. I personally like to look at what is happening at every individual angle anyway. I am indeed coming from the unusual perspective of using VituixCAD a lot as a speaker evaluation tool rather than a design tool, though hopefully I'll get to do some of the latter soon =]
Once more about ER+ERDI per plane. Have you noticed that power & DI has "always" been possible to calculate also separately in horizontal and vertical planes? In addition, intensity for power & DI calculation has "always" been possible to calculate as weighted R.M.S. or unweighted average from radial measurements. Weighted R.M.S. i.e. 'Intensity on spherical surface' option has been default as a standard and suitable for common speakers.
The latest built of rev. 2.0.51.3 (2020-06-08) calculates intensity as R.M.S. instead of normal average when 'Intensity on cylinder surface' is selected in Options.
Selecting 'Intensity on cylinder surface' and checking either 'Include horizontal' or 'Include vertical' is correct method to evaluate overall power & DI (~sound balance) in single plane. Not previously added horizontal and vertical totals of ER+ERDI.
Thank you! Looking forward to trying this
Few examples about similarity of power+DI and ER+ERDI in horizontal plane only. "Problem" is that ER+ERDI hor is now much easier to view than power+DI hor though importance is not necessarily that way.
Attachments
It's good to have all the visual options, especially for less traditional designs!
If I could bother you with another feature request... Have you considered adding solid colors for the polar maps rather than gradients btw, and the ability to change those colors? I think it makes it a bit easier to visualize directivity.
For example:
(I'm aware of the contour lines, but this is a little simpler).
As for the different colors, it isn't just me being picky about colors, it would help to be able to pick colors that are a bit more friendly to the colorblind:

If I could bother you with another feature request... Have you considered adding solid colors for the polar maps rather than gradients btw, and the ability to change those colors? I think it makes it a bit easier to visualize directivity.
For example:
(I'm aware of the contour lines, but this is a little simpler).
As for the different colors, it isn't just me being picky about colors
, it would help to be able to pick colors that are a bit more friendly to the colorblind:
Have you considered adding solid colors for the polar maps rather than gradients btw, and the ability to change those colors? I think it makes it a bit easier to visualize directivity.
Not seriously. I don't like steps hiding small changes within SPL categories. Your examples look quite bad imo
In addition, stepping instead of gradient probably needs different data processing i.e. whole new program.Small advantage would be much smaller file size of svg export. Poor implementation of contour lines with single pixels creates huge files.
it would help to be able to pick colors that are a bit more friendly to the colorblind:
Program has two different color circles for directivity charts already so few more palettes for colorblinds would be just swapping data in rgb arrays.
Not seriously. I don't like steps hiding small changes within SPL categories. Your examples look quite bad imo
Small advantage would be much smaller file size of svg export. Poor implementation of contour lines with single pixels creates huge files.
Program has two different color circles for directivity charts already so few more palettes for colorblinds would be just swapping data in rgb arrays.
Understood and thanks for hearing me out!
Rev. 2.0.51.0 (2020-06-03)
Graph overlay system renewed in the main program and Calculator, Diffraction, Enclosure and Merger tools. Add and Delete overlay buttons replaced with commands in context menu of each chart.
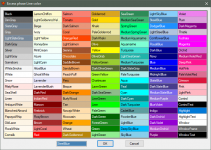
* Added 'Traces...' command to context menu of chart. Opens chart properties window allowing user to change visibility, description, colors and line width of each trace. Selected overlays are removed with 'Remove sel' button. All overlays are removed with 'Remove all' button. Multi-selection with row headers or top left corner. Line color and fill color with Area and Surface charts is selected from list of 'named colors' or with standard Colour dialog. Default color selection window can be changed by pressing Ctrl-key while clicking color cell.
* Added 'Save as overlay' command to context menu of chart. Saves selected (bold) trace, or all visible traces if none is selected. Overlay traces are not possible to overlay again.
* Added 'Open overlay...' command to context menu of chart. Response files are selected with file open dialog. Selection of primary/secondary Y-axis is automatic and not always reliable.
* Added support for Drag & Drop of overlay files. Traces are scaled with primary/left Y-axis if the files are dropped closer to Y-axis on the left. Traces are scaled with secondary/right Y-axis if the files are dropped closer to Y2-axis on the right.
* Total number of traces including overlays is limited to 37/chart.
Big thumbs up for the overlay overhaul, very useful compared to the previous simpler system.
Reminds me more of ARTA's overlay functionality now, which I use extensively.^Almost everything is technically possible but normally we don't have actual and reliable data much below 10 Hz. Also calculation would slow down by 43% if the lowest internal freq. point is dropped to 0.1 Hz. So answer is simple and clear: never.
If you need full frequency range from zero to Nyquist for some external tool requiring constant frequency steps, program has extrapolation to 0 Hz. Just export frequency responses with extension .fri.
If you need full frequency range from zero to Nyquist for some external tool requiring constant frequency steps, program has extrapolation to 0 Hz. Just export frequency responses with extension .fri.
This has not to do with regular loudspeaker measurements and optimizing multiway-systems , but rather with simulating and optimizing active analogue circuitry. It would be really handy to be able to sim down to 1 Hz here. Extrapolation does not work when I would like to sim and ***** e.g. phase behaviour of a 1 Hz highpass filter in the input stage of an (pre)amplifier. I know this can be done with LtSpice or Tina or Multisim both those simulators lack not only possibility -to my best of knowledge- to load a simmed circuit directly with measured .frd files, and do not have an optimizer either.
Just as a compliment for the immense versatility of VCad: ever thought of VCad as a powerful tool to optimize Opamp RIAA circuitry? Works like a charm. And yes, I know the Opmaps are "ideal"... So once again : 1 Hz would be wonderful.
Just as a compliment for the immense versatility of VCad: ever thought of VCad as a powerful tool to optimize Opamp RIAA circuitry? Works like a charm. And yes, I know the Opmaps are "ideal"... So once again : 1 Hz would be wonderful.
^1.25 Hz minimum wouldn't be so bad because band extends just two octaves instead of more than decade. Just tested that it works and not difficult to do. But calculation routine should be optimised before adding a single point because large amount of new features within last few years have reduced performance. Cannot promise anything right now.
- Home
- Design & Build
- Software Tools
- VituixCAD