Overlay in my case is not related in any way to the encosure tool: I want to be able to overlay unfiltered and variations on filtering of that same driver. BTW: my intended exercise has nothing to do with multiway system design, but with observing phase behaviour of various active filter-drivers combo's. Few of your users will use your program this way, but VCad is a true gem for optimizing active Opamp circuitry in general. The toggle option gives a wealth of insight in the impact of individual component values on the functioning of the circuit.
^Very good.
One overlay only in GD&Phase and Filter graphs is quite limited. Not the best for comparing more than two cases. Crossover variations (S and R buttons) enable switching of total eight different cases without toggling Open or Short or Mute status of components.
Power&DI has three dBSPL overlays and single dBDI overlay which can be loaded from file, but playing txt/frd file exports and file loading is not so fast.
Hello! Tell me please!
In the figure, the active midbass crossover block. where to connect these findings? Thank!
DropMeFiles – free one-click file sharing service
In the figure, the active midbass crossover block. where to connect these findings? Thank!
DropMeFiles – free one-click file sharing service
Last edited:
Hello! Tell me please!
In the figure, the active midbass crossover block. where to connect these findings? Thank!
DropMeFiles – free one-click file sharing service
Just leave them connected as they are now - the same as in your fig.
Thank you for the update with full early reflections component exports! A big time saver.
Perhaps for you to consider for further standardization with CTA-2034A, the ability to toggle on and off the different scaling for the DI curves? Tends to make the measurements look worse compared to other sources.
Cheers!
Perhaps for you to consider for further standardization with CTA-2034A, the ability to toggle on and off the different scaling for the DI curves? Tends to make the measurements look worse compared to other sources.
Cheers!
***I don’t know anything about it! Please tell us what it is about? What is this? Thank!Thank you for the update with full early reflections component exports! A big time saver.
Perhaps for you to consider for further standardization with CTA-2034A, the ability to toggle on and off the different scaling for the DI curves? Tends to make the measurements look worse compared to other sources.
Cheers!
Oleg
Just leave them connected as they are now - the same as in your fig.
***Thanks!
Oleg
***I don’t know anything about it! Please tell us what it is about? What is this? Thank!
Oleg
Hi Stankor. VituixCAD is able to automatically calculate the 'Early Reflections' curve from CTA-2034A or 'Spinorama' standard. But the Early Reflections Curve itself is made up of five averages:
Front: Horizontal Average of 0, +/- 10,20,30 degrees
Side: +- 40, 50, 60, 70, 80
Rear: 180, +/- 90, 100, 110...170
Ceiling: Vertical +40,50,60
Floor: Vertical - 20, 30, 40
These curves can further be combined into total horizontal and total vertical reflections.
I like to look at the individual components of the Early Reflections curve, because I like to know which parts are influencing it. For example,many speakers show a crossover dip in the early reflections curve. I like to see how much of that dip is because of the horizontal data and how much of it is vertical, since we know the horizontal data has a bigger influence on our perception of imaging/soundstage.
If you combine the horizontal averages to get 'Total Horizontal reflections,' I feel this is the most useful individual curve for describing soundstage performance. You could also calculate the difference between this and REW to get a 'horizontal DI' curve. This is not a part of CTA-2034A, but I like calculating it for my own analyses.
You can of course also gather this from the polar maps, but I personally prefer to work with SPL charts.
With the latest update to vituixcad, you can both view and export the full component curves for early reflections.
Last edited:
Hi Stankor. VituixCAD is able to automatically calculate the 'Early Reflections' curve from CTA-2034A or 'Spinorama' standard. But the Early Reflections Curve itself is made up of five averages:
Front: Horizontal Average of 0, +/- 10,20,30 degrees
Side: +- 40, 50, 60, 70, 80
Rear: 180, +/- 90, 100, 110...170
Ceiling: Vertical +40,50,60
Floor: Vertical - 20, 30, 40
These curves can further be combined into total horizontal and total vertical reflections.
I like to look at the individual components of the Early Reflections curve, because I like to know which parts are influencing it. For example,many speakers show a crossover dip in the early reflections curve. I like to see how much of that dip is because of the horizontal data and how much of it is vertical, since we know the horizontal data has a bigger influence on our perception of imaging/soundstage.
If you combine the horizontal averages to get 'Total Horizontal reflections,' I feel this is the most useful individual curve for describing soundstage performance. You could also calculate the difference between this and REW to get a 'horizontal DI' curve. This is not a part of CTA-2034A, but I like calculating it for my own analyses.
You can of course also gather this from the polar maps, but I personally prefer to work with SPL charts.
With the latest update to vituixcad, you can both view and export the full component curves for early reflections.
***Wow! Intuitively, I understand what you are talking about, but I don’t know at all how to do it! Take me as a student for a while.
") I want to make use of it! What do I need to do first?
I want to make use of it! What do I need to do first? Thank!
Oleg
Hello Kimmo,
After optimizing an analogue active filter in VCad, is there a trick to list the filter coefficients of that filter transfer function in order to export those for use in e.g. Equalizer Apo?
I noticed one can copy and paste the coeffs for digital biquads, but my question relates to analogue
After optimizing an analogue active filter in VCad, is there a trick to list the filter coefficients of that filter transfer function in order to export those for use in e.g. Equalizer Apo?
I noticed one can copy and paste the coeffs for digital biquads, but my question relates to analogue
^You can export transfer function at driver terminals (or active buffer output) as impulse response file and import to FIR convolution in Equalizer APO.
Supported file formats: 16-bit PCM mono (.wav), 16-bit PCM stereo (.wav), 24-bit PCM mono (.wav), 24-bit PCM stereo (.wav), 32-bit IEEE mono (.wav), 32-bit IEEE stereo (.wav), 64-bit IEEE mono (.wav), 64-bit IEEE stereo (.wav), 32/64-bit text (.txt), 32/64-bit MLSSA (.txt), miniDSP binary file (.bin), miniDSP manual mode (.txt, copied also to clipboard).
Export feature is located in Impulse response window.
Basically this is very close to working with rePhase, but source signal (in frequency domain) of each impulse response to export is taken from input of driver instances in the crossover.
Hi Kimmosto,
Vituixcad is a wonderful tool. Its so easy to visualise the polars of a multi driver system. Combined with SPL trace tool, it gets one so close to getting a feel of what to expect from a real system, this makes it really powerful. Thank you for making it available to DIYers.
Warm Regards,
WA
Vituixcad is a wonderful tool. Its so easy to visualise the polars of a multi driver system. Combined with SPL trace tool, it gets one so close to getting a feel of what to expect from a real system, this makes it really powerful. Thank you for making it available to DIYers.
Warm Regards,
WA
I tried to simulate a 3 driver arrangement as below and noticed something surprising. Its a fullrange center driver surrounded by 2 low passed outer drivers. The outer drivers' LP is LR12@24Khz and the resulting polar at 6Khz is shown.
Here is the polar with the LP
Here is the polar with the LP
Attachments
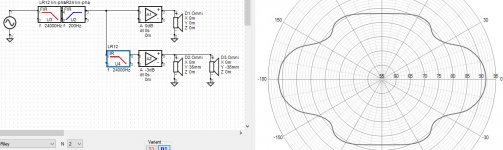
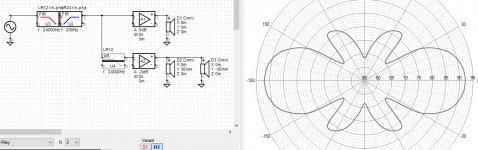
Here is the polar without LP
I expected to see no effect of the LP on polar chart at 6khz because the chart is being observed at two octaves lower than LP, but the polars with and without the LP are drastically different. Can you pls check?
Note:-No directivity files were specified for the drivers
I expected to see no effect of the LP on polar chart at 6khz because the chart is being observed at two octaves lower than LP, but the polars with and without the LP are drastically different. Can you pls check?
Note:-No directivity files were specified for the drivers
Attachments
Rev. 2.0.51.0 (2020-06-03)
Graph overlay system renewed in the main program and Calculator, Diffraction, Enclosure and Merger tools. Add and Delete overlay buttons replaced with commands in context menu of each chart.
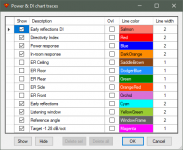
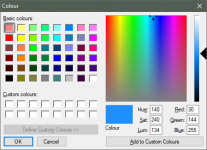
* Added 'Traces...' command to context menu of chart. Opens chart properties window allowing user to change visibility, description, colors and line width of each trace. Selected overlays are removed with 'Remove sel' button. All overlays are removed with 'Remove all' button. Multi-selection with row headers or top left corner. Line color and fill color with Area and Surface charts is selected from list of 'named colors' or with standard Colour dialog. Default color selection window can be changed by pressing Ctrl-key while clicking color cell.
* Added 'Save as overlay' command to context menu of chart. Saves selected (bold) trace, or all visible traces if none is selected. Overlay traces are not possible to overlay again.
* Added 'Open overlay...' command to context menu of chart. Response files are selected with file open dialog. Selection of primary/secondary Y-axis is automatic and not always reliable.
* Added support for Drag & Drop of overlay files. Traces are scaled with primary/left Y-axis if the files are dropped closer to Y-axis on the left. Traces are scaled with secondary/right Y-axis if the files are dropped closer to Y2-axis on the right.
* Total number of traces including overlays is limited to 37/chart.
Graph overlay system renewed in the main program and Calculator, Diffraction, Enclosure and Merger tools. Add and Delete overlay buttons replaced with commands in context menu of each chart.
* Added 'Traces...' command to context menu of chart. Opens chart properties window allowing user to change visibility, description, colors and line width of each trace. Selected overlays are removed with 'Remove sel' button. All overlays are removed with 'Remove all' button. Multi-selection with row headers or top left corner. Line color and fill color with Area and Surface charts is selected from list of 'named colors' or with standard Colour dialog. Default color selection window can be changed by pressing Ctrl-key while clicking color cell.
* Added 'Save as overlay' command to context menu of chart. Saves selected (bold) trace, or all visible traces if none is selected. Overlay traces are not possible to overlay again.
* Added 'Open overlay...' command to context menu of chart. Response files are selected with file open dialog. Selection of primary/secondary Y-axis is automatic and not always reliable.
* Added support for Drag & Drop of overlay files. Traces are scaled with primary/left Y-axis if the files are dropped closer to Y-axis on the left. Traces are scaled with secondary/right Y-axis if the files are dropped closer to Y2-axis on the right.
* Total number of traces including overlays is limited to 37/chart.
Attachments
I expected to see no effect of the LP on polar chart at 6khz because the chart is being observed at two octaves lower than LP, but the polars with and without the LP are drastically different.
Significant difference is actually obvious because LR12 low pass @24 kHz has phase shift of -28 deg at 6 kHz.
- Home
- Design & Build
- Software Tools
- VituixCAD