^That is now fixed to rev. 2.0.10.4.
Obviously Transfer function file block hasn't been very popular because file reading & response refreshing after File->Open has been missing since 2.0.4.8 (2018-09-02). XO scenario feature generated also path handling issue to 2.0.7.0 (2018-11-26) but that couldn't make this block any worse.
Obviously Transfer function file block hasn't been very popular because file reading & response refreshing after File->Open has been missing since 2.0.4.8 (2018-09-02). XO scenario feature generated also path handling issue to 2.0.7.0 (2018-11-26) but that couldn't make this block any worse.
Measurement sections on pages 2-6 updated in Preparation of response measurements for crossover simulation with VituixCAD 2019-01-13. Refresh to see the latest.
This document will never be entirely "ready", but I will fix errors and add answers to frequently asked and important questions also in the future. Detailed instructions to all possible situations and speaker types is not possible.
This document will never be entirely "ready", but I will fix errors and add answers to frequently asked and important questions also in the future. Detailed instructions to all possible situations and speaker types is not possible.
It would be great if it were possible to load some "target curves" from external files (FRD format or similar). These curves would then be displayed in the background of the SPL chart (as thin light grey lines?) in order to serve as targets when designing the x-over. This would be very useful to understand how close a given filter design gets to a predefined target, which is very difficult at the moment.
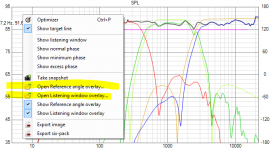
^You can load two files as overlays to SPL chart via context menu, but they cannot be used as acoustical target for Optimizer.
Loaded overlay of Filter chart can be user as a target for Optimizer while iterating filter's transfer function. This feature is designed for filter cloning from speaker with unknown component values.
Loaded overlay of Filter chart can be user as a target for Optimizer while iterating filter's transfer function. This feature is designed for filter cloning from speaker with unknown component values.
^You can load two files as overlays to SPL chart via context menu, but they cannot be used as acoustical target for Optimizer.
That's a good start! I don't mind too much if the optimizer does not use these target curves. However, it would be better to have more than just two target curves for speakers with 3 or more ways.
Each driver can have individual textbook target curve for acoustical response to reference angle visible in SPL chart. This could mean e.g. 20 individual target curves in practice.
Total SPL (to ref angle) and power response have straight target lines in SPL and Power & DI charts. Both charts have two overlays (with left Y scale) which can be loaded from file. Reload is needed with multi-driver application if response files are used as manual targets for individual drivers. Optimizer is not available for this.
Filter transfer function has single/common target curve which can be loaded to Filter chart. Reload is needed when moving to next driver.
That's it. Unlimited possibilities are available, but some design methods take more time. I'm not willing to add support for design methods which are not effective and rational imo.
Each driver can have individual textbook target curve for acoustical response to reference angle visible in SPL chart.
Aha!? How do I do that? The only way to load a target curve I have found is to right click on the SPL chart and load a target curve for either the "reference angle overlay" or the "listening window overlay". I can get two target curves like this, but not more.
^First I have to underline that driver target curves are not loadable from response files. They are ideal text book curves you specify in Optimizer window with seven parameters; for high pass, low pass and SPL.
If this was not terrible disappointment, continue to user manual page 18 section "SPL Target curve of Driver". Refresh pdf that you have the latest version for 2.0.10.4 (2019-01-16).
One driver target can be visible at a time so Optimizer window should be open to change driver and visible target with list box.
^First I have to underline that driver target curves are not loadable from response files. They are ideal text book curves you specify in Optimizer window with seven parameters; for high pass, low pass and SPL.
Ok, I see. I'd need to load the curves from a data file because the textbook functions included in the Vituix list of target functions don't have what I need.
Ok, I see. I'd need to load the curves from a data file because the textbook functions included in the Vituix list of target functions don't have what I need.
Could you show or send me an example target? Loadable acoustical target for driver SPL would be quite easy to add, but I'd like to see some arguments before doing anything. I'm aware that special acoustical targets could be helpful in some (rare) cases, but existing two targets in SPL chart are available for that if Optimizer is not needed. Reloading takes less than 5 seconds so this shouldn't be a problem.
Driver's acoustical target is usually just preliminary and textbook curve is adequate because axial, off-axis, power and DI responses are what we're actually designing. Not some individual driver. Exception is speaker cloning which is best to do with electrical target response because accurate and smooth acoustical target is difficult to produce e.g. by measuring at home.
In addition, Calculator tool is able create electrical target by driver's raw (axial) response and special acoustical target, but this takes few extra minutes. This workaround is available if one would like to adjust also driver's acoustical response with Optimizer.
Hello,
I'm wondering how to compensate for the tweeters high pass filter used in the measurements (to protect the tweeter).
I.e this filter gives the tweeter measurements a roll off, and if I simulate my crossover based on these tweeter measurements the simulated slope should be steeper than in reality?
How do you guys handle this (if it is a problem, that is)? Could you e.g simulate the transfer function gain of the protective high pass filter used in the measurements and then simply subtract the attenuation it gives from the measured response?
Could you show or send me an example target?
Take a look at this post and the files in the attachment.
Loadable acoustical target for driver SPL would be quite easy to add, but I'd like to see some arguments before doing anything. I'm aware that special acoustical targets could be helpful ... Driver's acoustical target is usually just preliminary and textbook curve is adequate because axial, off-axis, power and DI responses are what we're actually designing. Not some individual driver.
I mostly agree with this. I am not a "textbook filter" fanatic at all. However, different people have different opinions and approaches to filter design, and it would be great to have target curves in Vituix to allow exploring these concepts.
Obvious target curves are the low pass and high pass filters for various textbook crossovers. One imports the target then adds equalization filters to match the measurement to the target. Of course everyone likely has a different target in mind so file import of targets created in things like Rephase and REW is a more general solution.
...it would be great to have target curves in Vituix to allow exploring these concepts.
Target curve generated with some external tool can be used as a driver response for studying and exploring. Directivity i.e. off-axis responses can be generated for theoretical driver's axial response with either diffraction simulator or measurement data. This enables checking how some filter philosophy fits into personal preferences related to e.g. smoothness of power and DI, timing/phase linearity and GD, vertical lobing, total directivity etc. No need to design filter at all to get some basic info for decisions.
Steep mathematical filters such as linked files are also quite valid targets for filter transfer function assuming that acoustical responses don't need much EQ and Optimizer can solve the puzzle. That is far from certain with deep notches and peaks due to features of amoeba algorithm.
Summary: Easiest method for that kind if special cases is loading to overlay of SPL chart. Rational user adjusts one driver at a time so few extra clicks between drivers is nothing.
...it would be great to have target curves in Vituix to allow exploring these concepts.
Could be wrong here you need help so ignore if you already got it so far : ) Feature is not called or named as target curve but a rightclick with mouse in SPL plot brings two options for loading overlays as seen below for your tweeter and mid and when done shift tweeters overlay with woofers target curve:
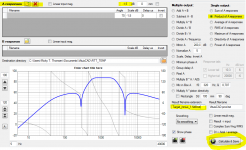
Should those target curves need some SPL offset to fit the puzzle use Calculator tool as in example where mid is lowered minus 1,5dB:
Attachments
Last edited:
Should those target curves need some SPL offset to fit the puzzle use...
Level of visible overlay(s) can be adjusted simply with mouse wheel above the chart. First hide overlays you don't want to adjust by unchecking Show ... overlay and then wheel up/down on SPL chart.
PS. Scale, Delay, Invert A function is designed for scaling in Calculator, though Sum, Product, Average etc work too if only one response is loaded into file list A.
Could be wrong here you need help so ignore if you already got it so far : ) Feature is not called or named as target curve but a rightclick with mouse in SPL plot brings two options for loading overlays...
Yes, that's a workaround if you're happy with only two target overlays. It would be nicer to have targets for every driver, though.
On another note, I found that the axis formats are a bit awkward:
- The axes just have numbers, but no proper labels and no units. I know that Vituix does give the user some hints using the on-screen popups when hovering over the curves with the mouse. However, once the plots are exported, this help is gone and the plots are more difficult to understand. Adding proper axis labels and units would really help.
- A legend or labels for the different curves in each plot/panel would also be useful so that people understand the meaning of the curves.
- Setting the axis limits to some user-defined values would be useful, especially for comparion of different designs. When the two designs have slightly different SPL levels, Vituix will use different axis limits, which, again, makes it harder to understand what's in the plots.
- The frequency axes show 100, 1000, and 1000 instead of 100, 1000, 10000 or 100, 1k, 10k.
I have a bit related suggestion if Kimmo agrees.
As is, the Enclosure tool does not follow the main program Options -> Frequency range setting. Would it be possible to enable that? With low end tuning other programs tend to use limited upper range and this always needs some getting used to with VCAD especially when all 6 graphs are on screen.
As is, the Enclosure tool does not follow the main program Options -> Frequency range setting. Would it be possible to enable that? With low end tuning other programs tend to use limited upper range and this always needs some getting used to with VCAD especially when all 6 graphs are on screen.
Sorry for these "complaints", but I guess it shouldn't be too difficult to fix these issues.
You're not the first one and last one use who is complaining missing publishing and community features. This topic pops up once a year via e-mail or other forum. I think it's clearly visible that VCAD is designed for personal / single designer use. Designer should be able to identify curves, units and axes without a single extra text. For example I can read your simulations without problems just by looking chart name and colors. But those who have been married with some other programs might have some difficulties.
I've had low priority plans related to X axis: more values and 1k...20k formatting. Labels are actually quite challenging due to almost unlimited scalability of the program. Single chart could have tens ... more than hundred curves. Not enough room for separate legend box, and curve labels could fill and mess chart area badly without smart layout logic or Show/hide all switch. At least I don't need additional tips.
Some people like to play with Y max and span though that also does not affect to design quality and sound. Common span for main program and some tools, and project differences requires visits in Options window which is not always so motivating. Generally all charts with automatic Y max work much better than charts with manual Y max, imo.
Almost everything is possible and program is improving step by step. Wishes are usually reasonable so there's always some hope
")
- Home
- Design & Build
- Software Tools
- VituixCAD